Correction: This article previously presented funding changes, population trends, and homeschooling as explanations for the enrollment decline. Those explanations and outside numerical comparisons have been removed because the state’s enrollment records do not establish where students went or why. The enrollment counts and district comparisons remain unchanged. The district-loss comparison now explicitly describes losses among shrinking districts.
In this series: Mississippi 2025-26 Enrollment.
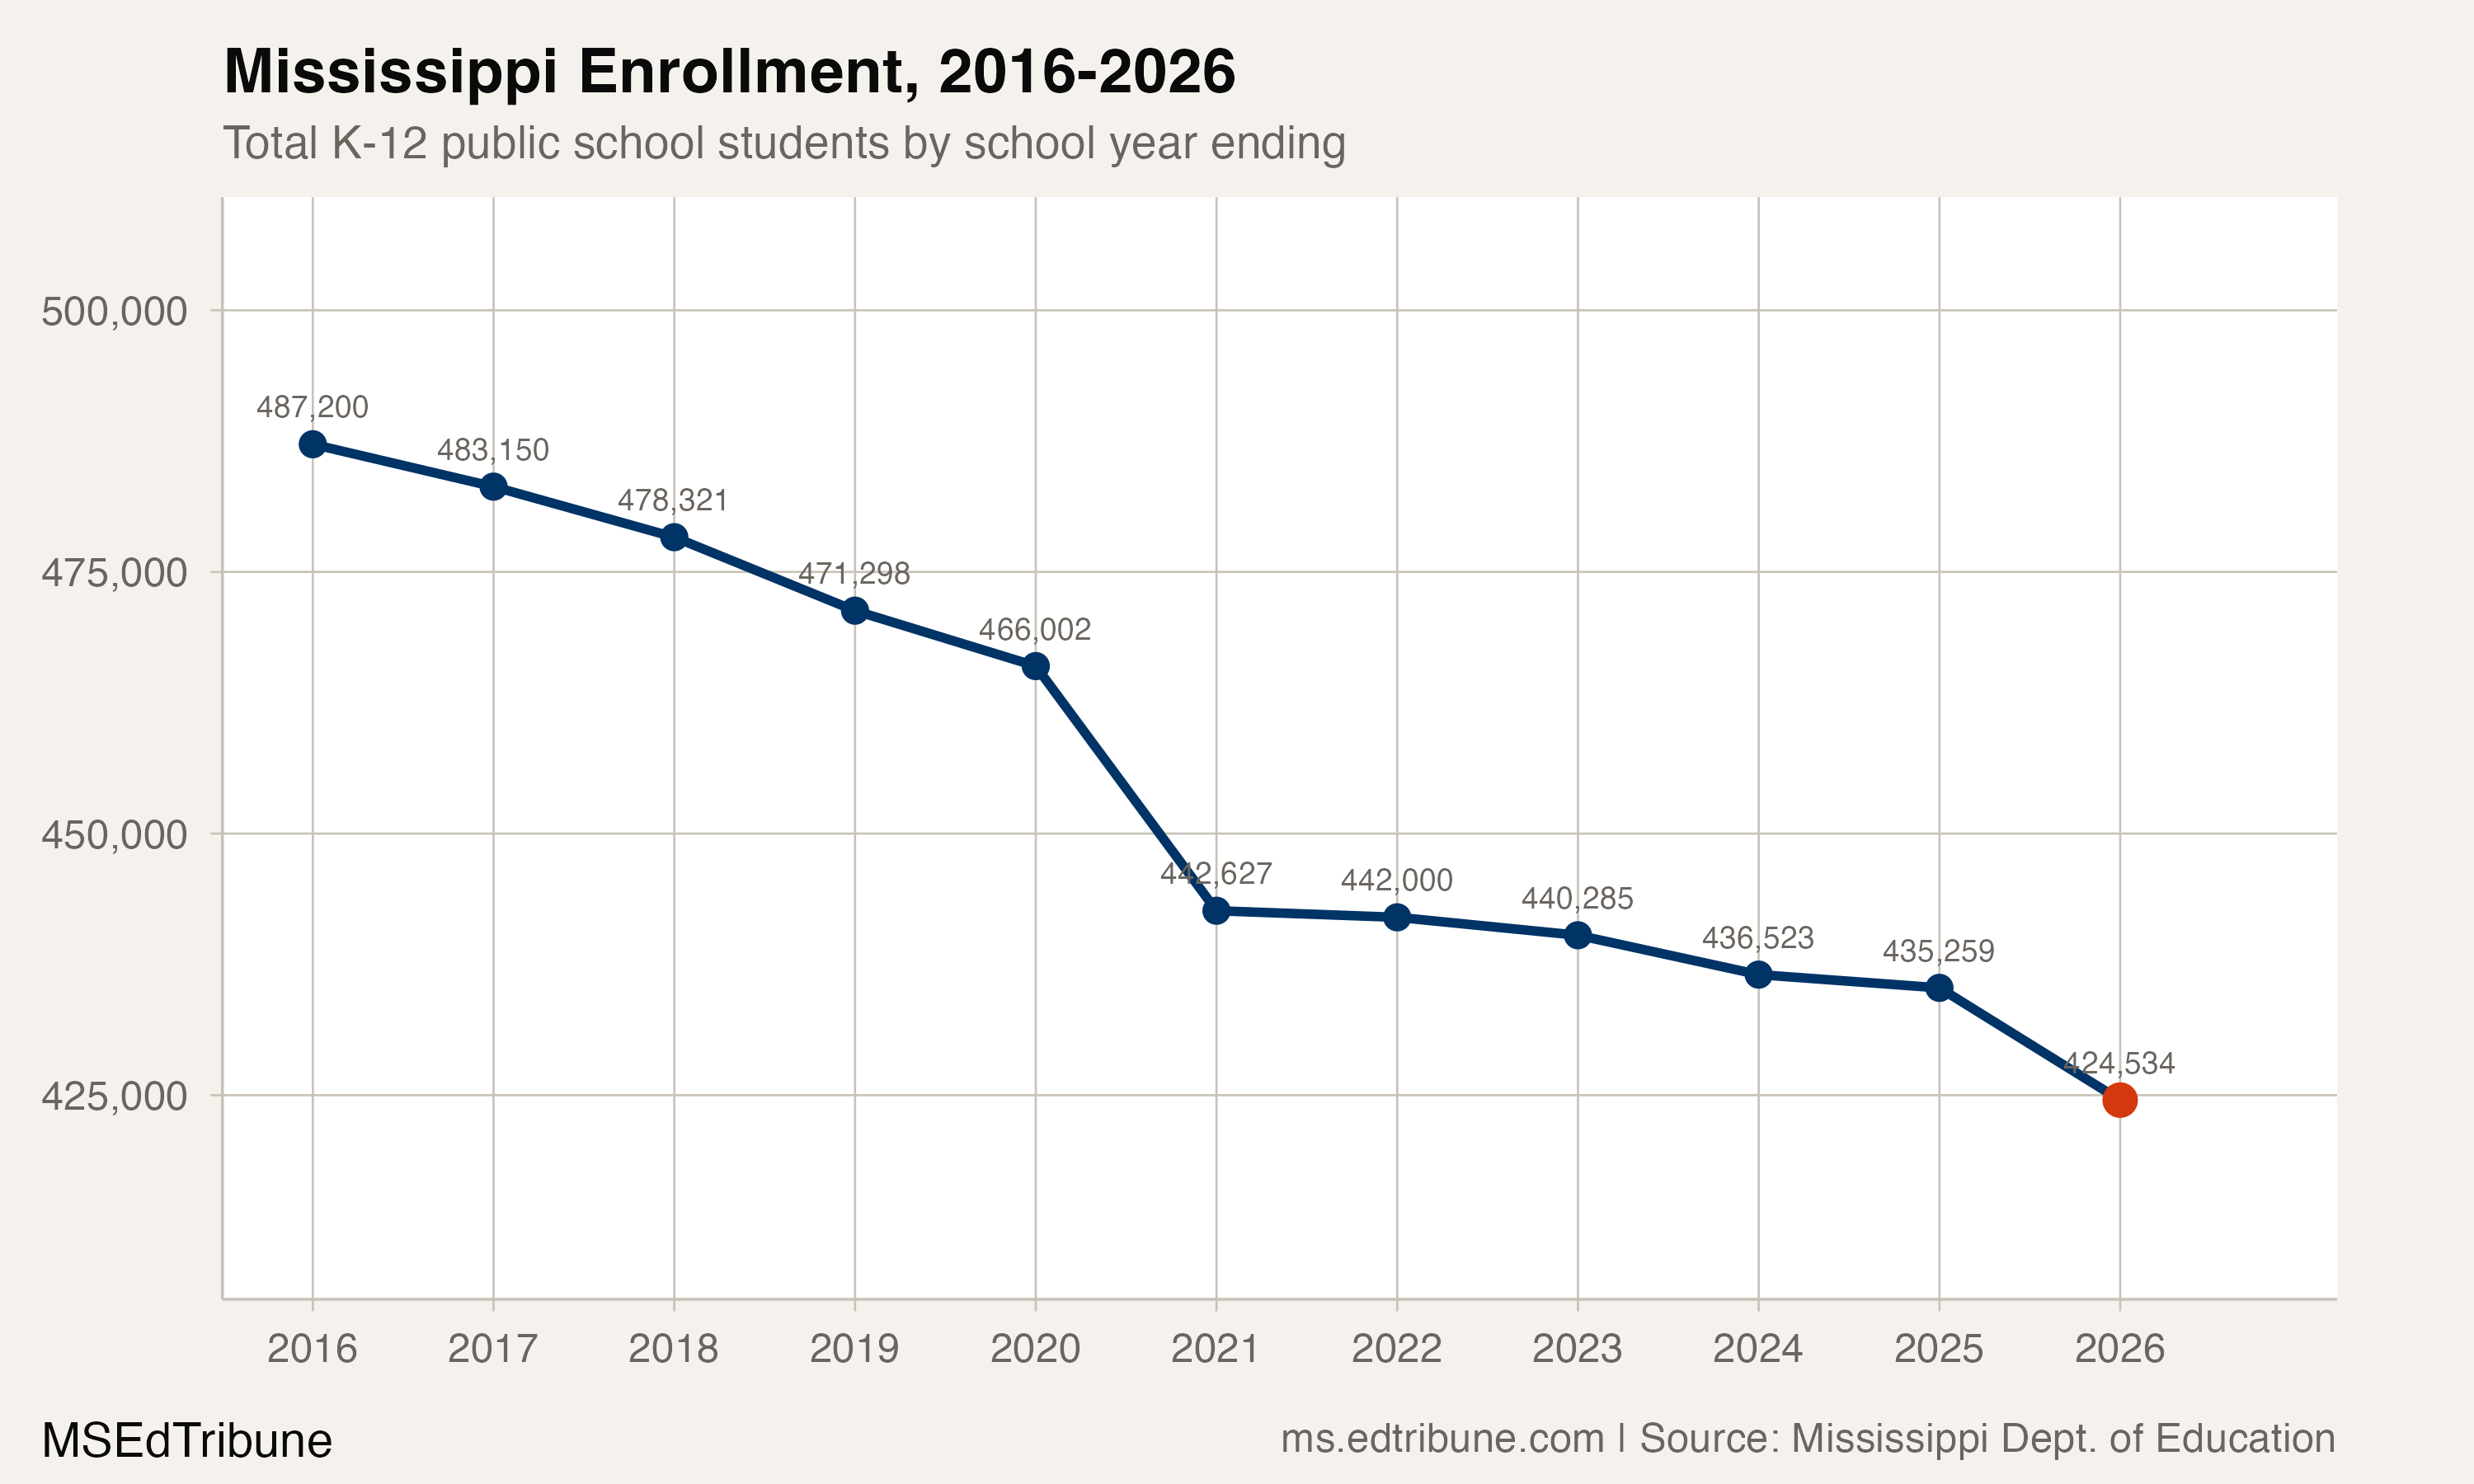
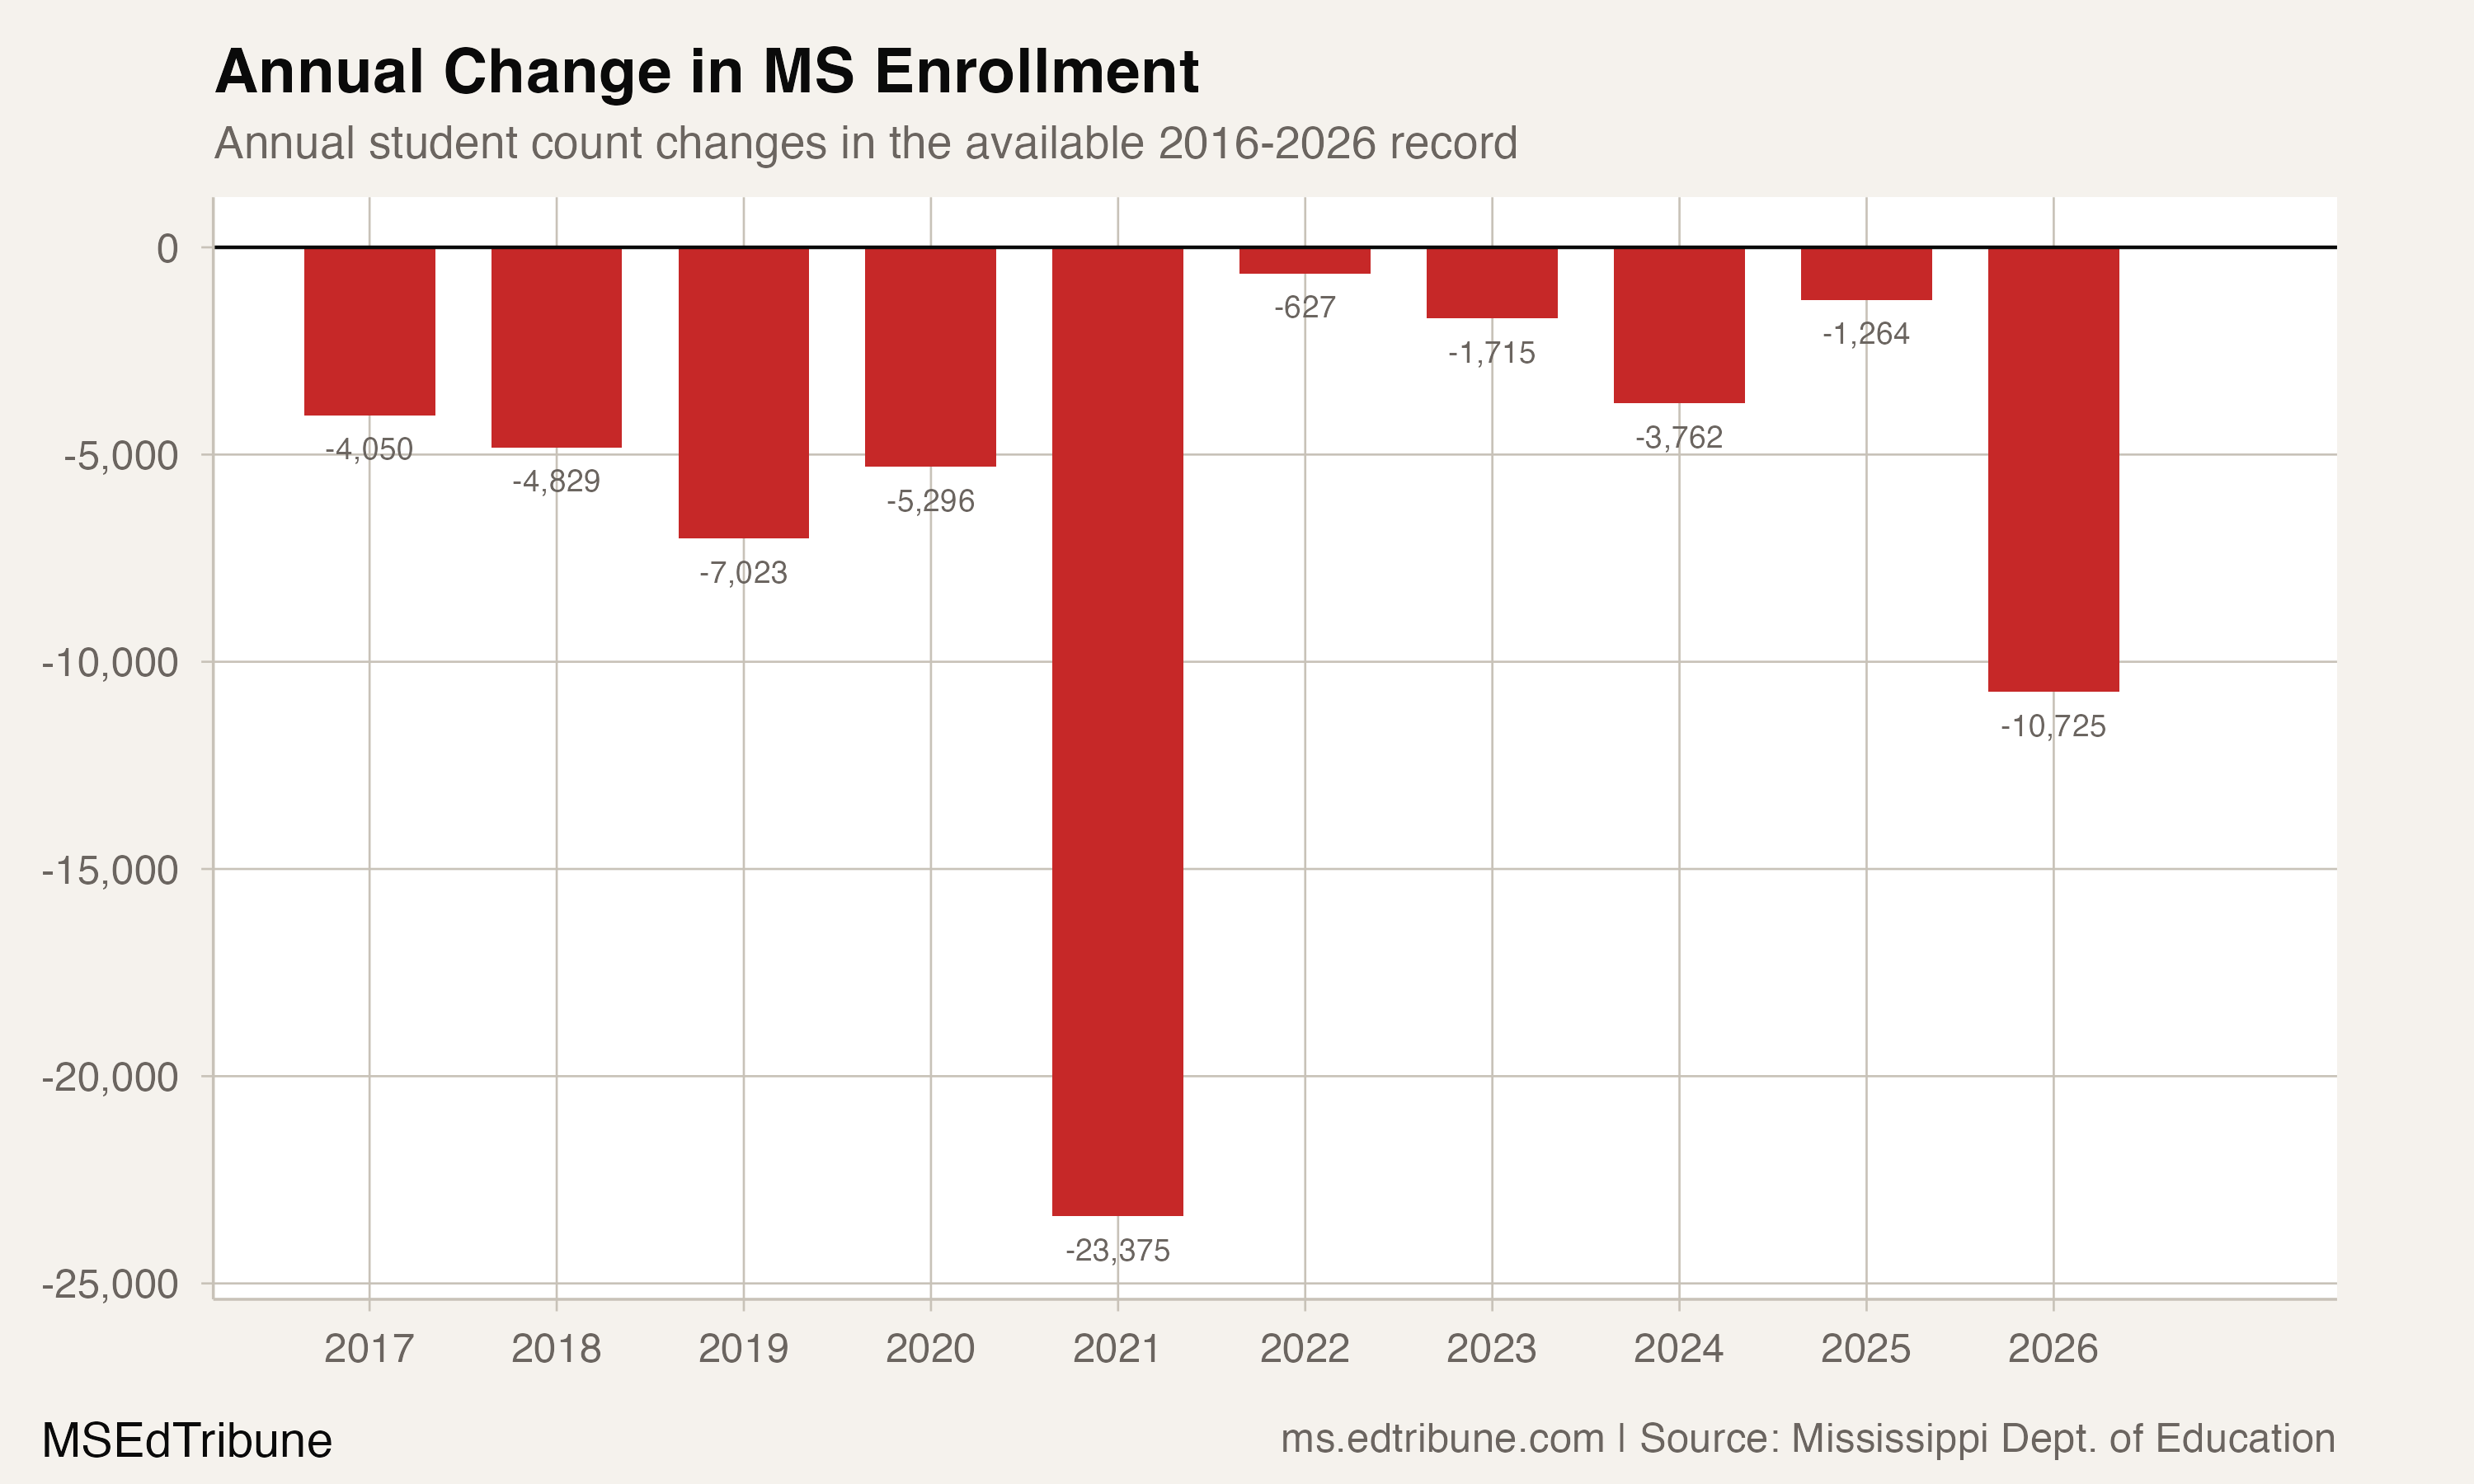
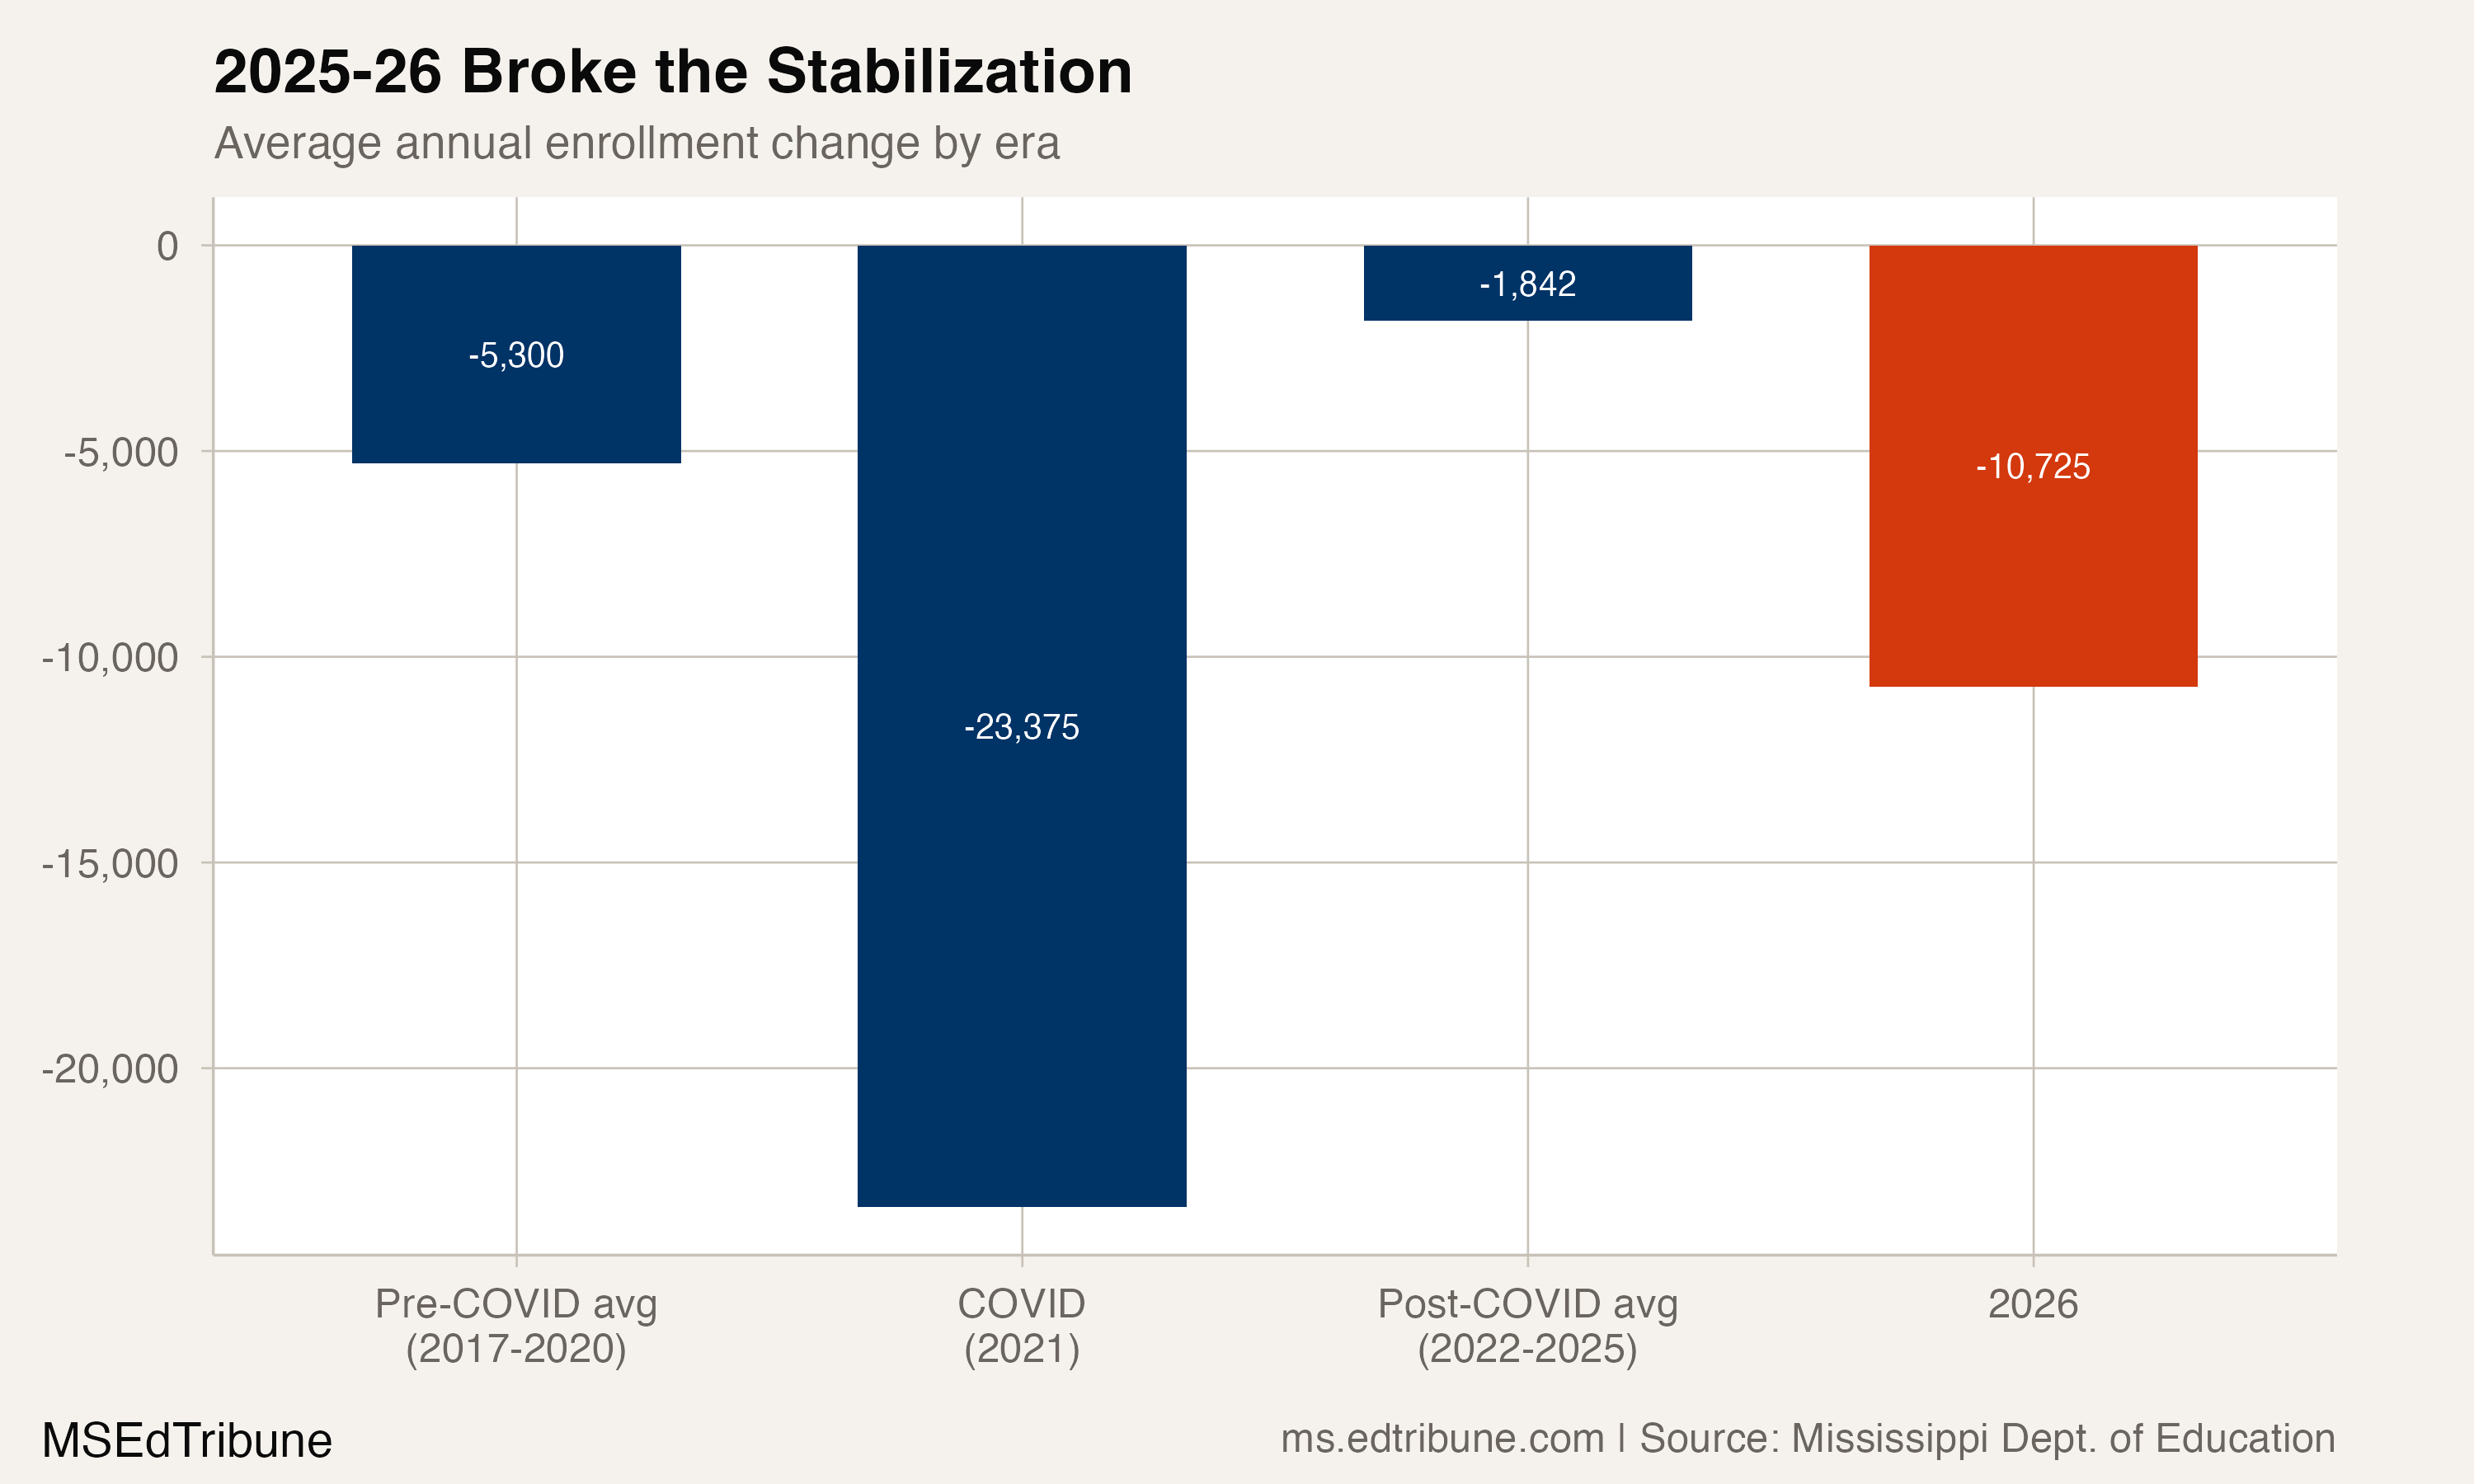
Mississippi's annual enrollment losses slowed after the pandemic to roughly 1,800 students per year. Then last school year's loss broke that pattern. The 2025-26 count showed: 10,725 students gone in a single year, a 2.5% drop, the largest annual loss apart from the COVID-year decline in the available record. That count, released by the Mississippi Department of Education, is the most recent year of published enrollment data, and the figures below all describe it rather than the classrooms districts are running today.
Losses appeared across the district panel. Of 152 districts reporting data in both years, 125 lost students. Only 26 gained, and one finished exactly where it started. The decline cut across every district size class. Eighty-seven districts, more than half those reporting last school year's total, had their lowest observed enrollment within the 11-year data window.
Three eras, one direction
Mississippi's enrollment story since 2016 falls into three distinct chapters. Before COVID, the state lost an average of 5,300 students per year, a sustained decline. The COVID-year count fell by 23,375 students. Losses then slowed: from 2022 through 2025, annual losses averaged 1,842 students.
The 2025-26 loss ended that slower pace. At 10,725 students, the loss is 5.8 times the post-COVID average and double the pre-COVID pace. It brought total enrollment to 424,534, the lowest figure in the dataset and 62,666 students (12.9%) below the 2016 level of 487,200.
Which districts reported losses
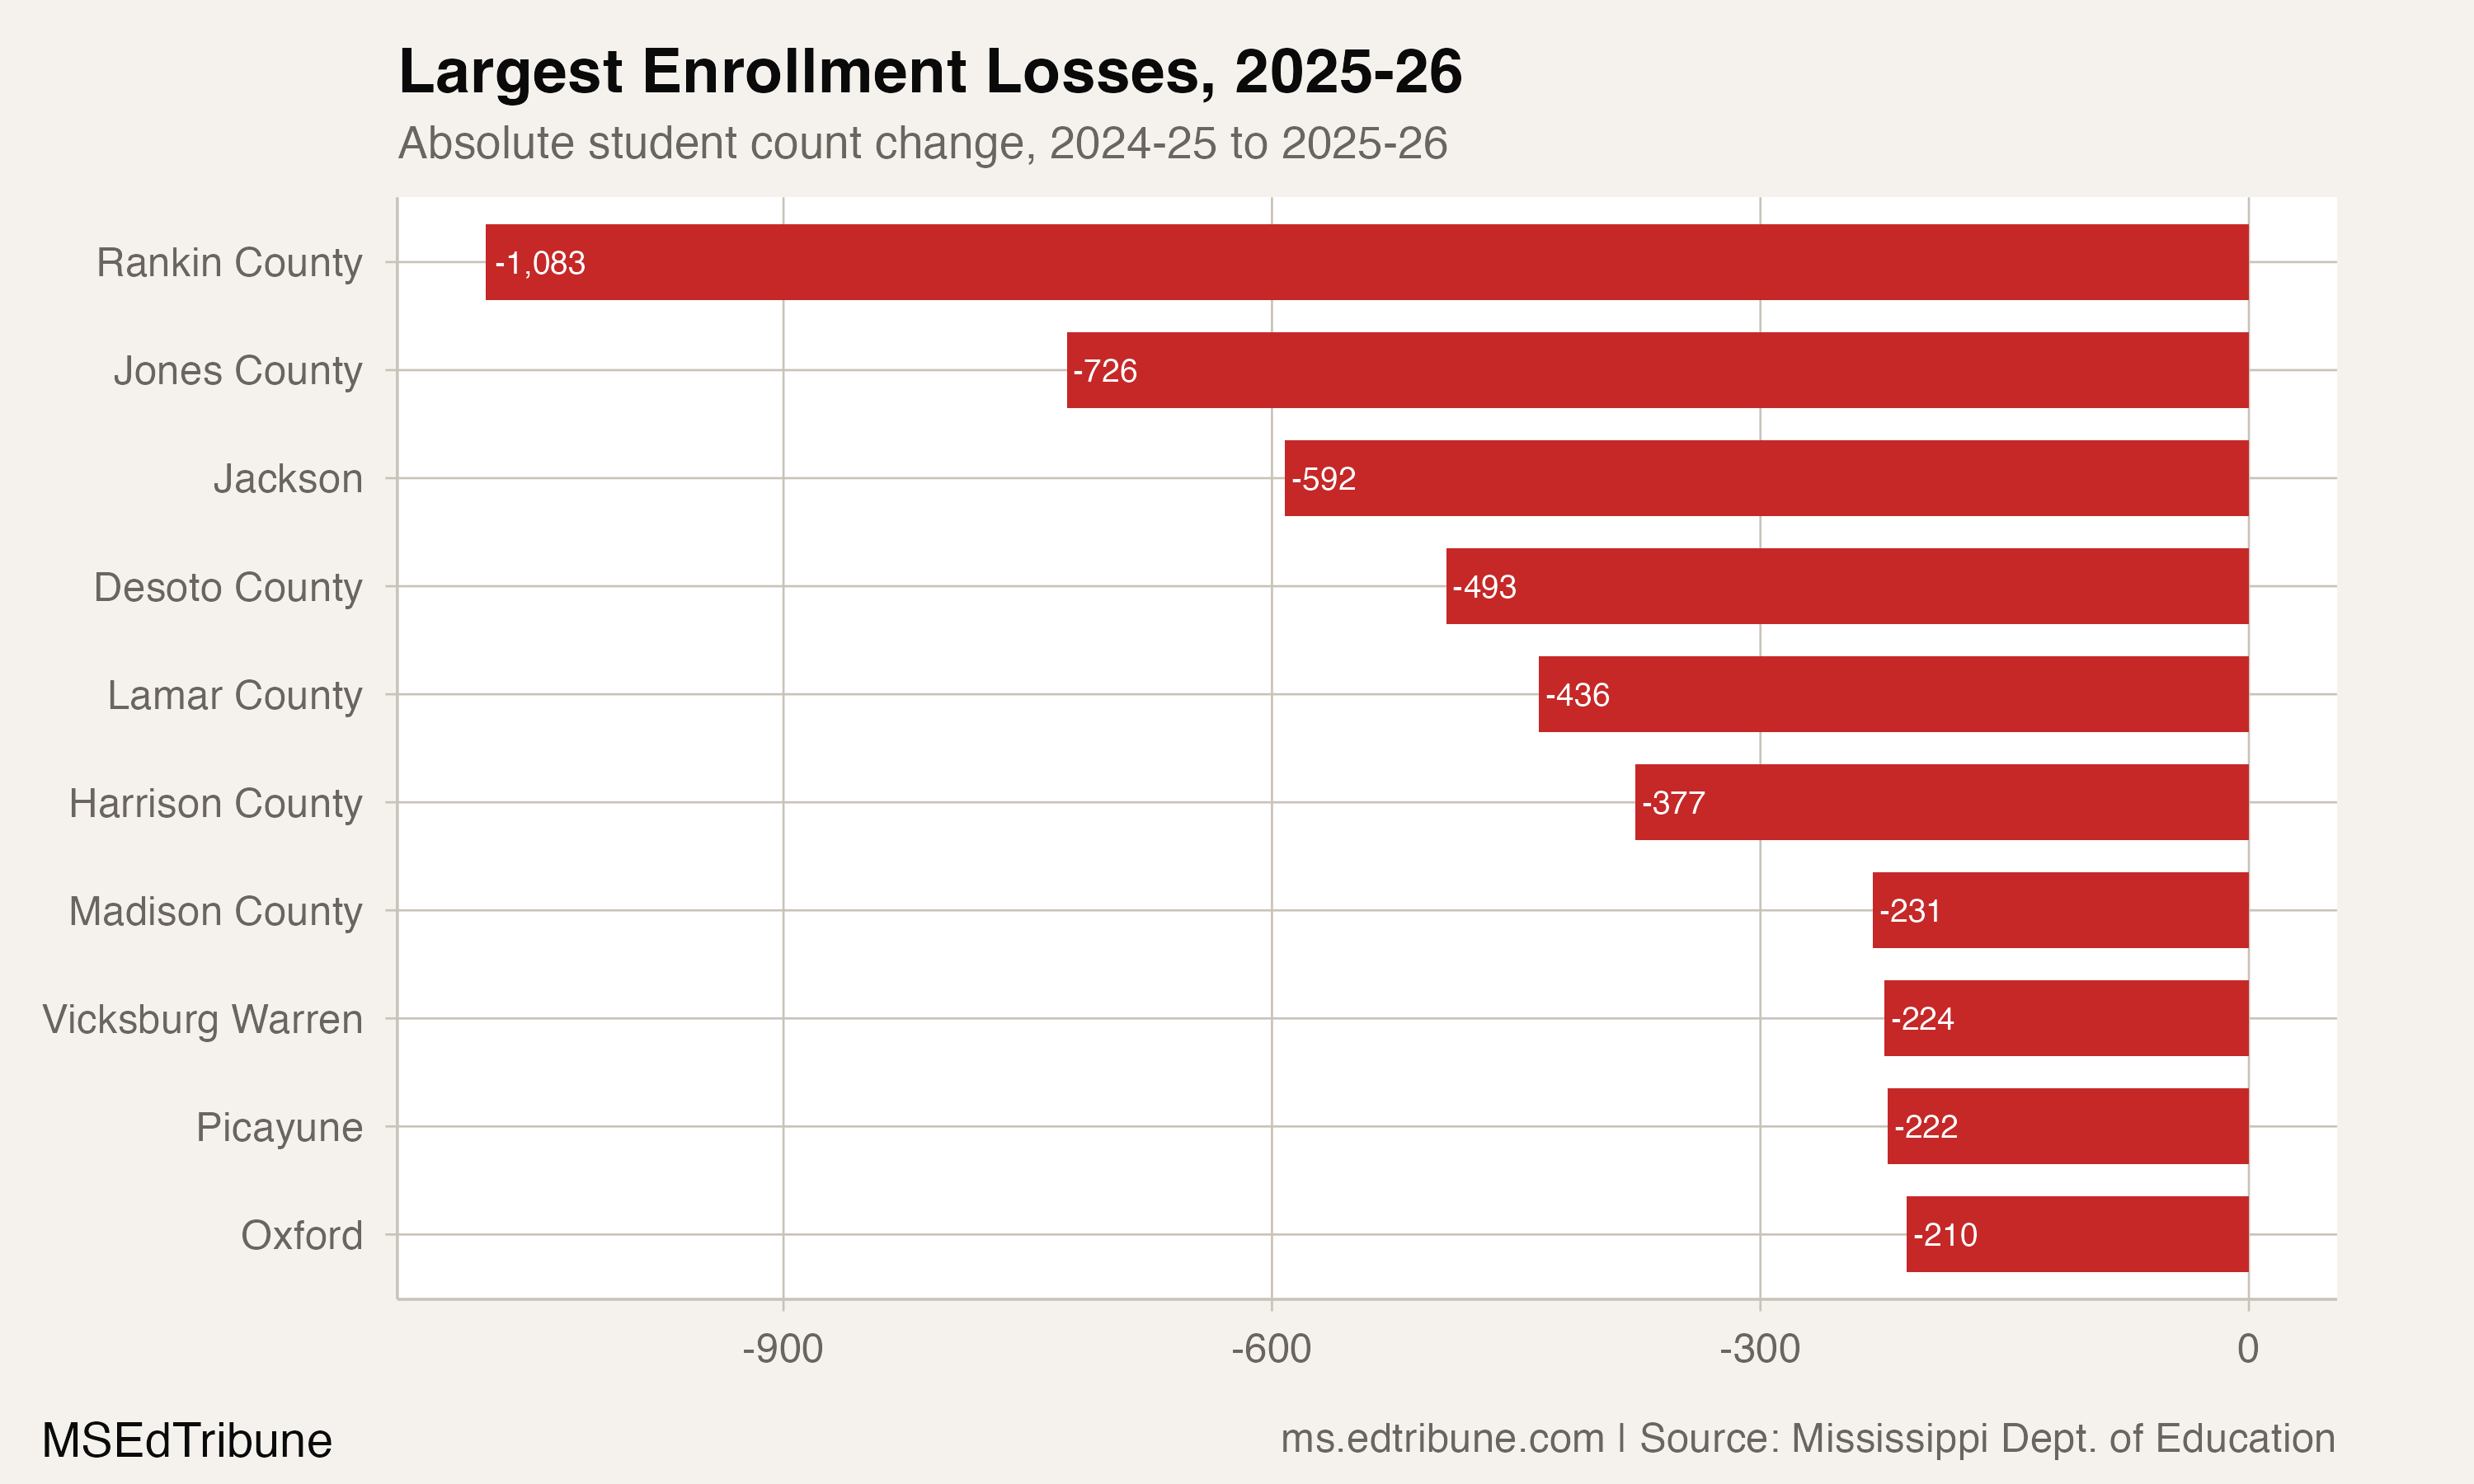
The losses were diffuse. The 10 largest district losses accounted for 39.8% of the combined losses among districts that shrank, meaning the remaining 60% was spread across 115 other shrinking districts.
Rankin County↗ET led with a loss of 1,083 students (-5.7%), a reversal after gaining 561 students the prior year. Jones County↗ET lost 726 (-7.8%). Jackson Public Schools↗ET shed 592 students (-3.4%). DeSoto County↗ET lost 493 students (-1.4%).
In DeSoto, Superintendent Cory Uselton described the loss as consistent with long-term variability rather than a break from pattern. "Enrollment can shift for many reasons," Uselton said. "We look at housing patterns, the economy, birth rates, and normal year-to-year movement between schools within our own district." Uselton added that the district monitors enrollment "across all grade levels" and makes planning decisions based on long-term trends. "Kindergarten enrollment is important, but it is only one part of the overall picture in a district of this size."
Thirty-seven districts followed a bounceback-and-bust pattern: they gained students in 2024-25, then lost them again the next year. In 23 of those districts the second-year loss was larger than the first-year gain. Rankin and Jones are the most prominent examples. Whether these reversals reflect a shift in when families enrolled, a count-date methodology change, or genuine year-to-year volatility cannot be determined from enrollment counts alone.
Rankin County's superintendent, Shane Sanders, offered a different read of his district's reversal. In a written statement, Sanders said: "From our perspective, the recent shift aligns with those long-term projections and does not come as a surprise." He attributed the year-to-year variance to "a combination of natural demographic shifts and the timing of enrollment reporting" and said the district's data is "best understood over a longer trend line rather than a single year comparison."
No district size was spared
Mid-size districts (2,000 to 4,999 students) absorbed the largest share of losses: 3,339 students across 53 districts. The six districts with 10,000 or more students collectively lost 3,212. Even the 42 smallest districts, those with fewer than 1,000 students, lost 500 between them.
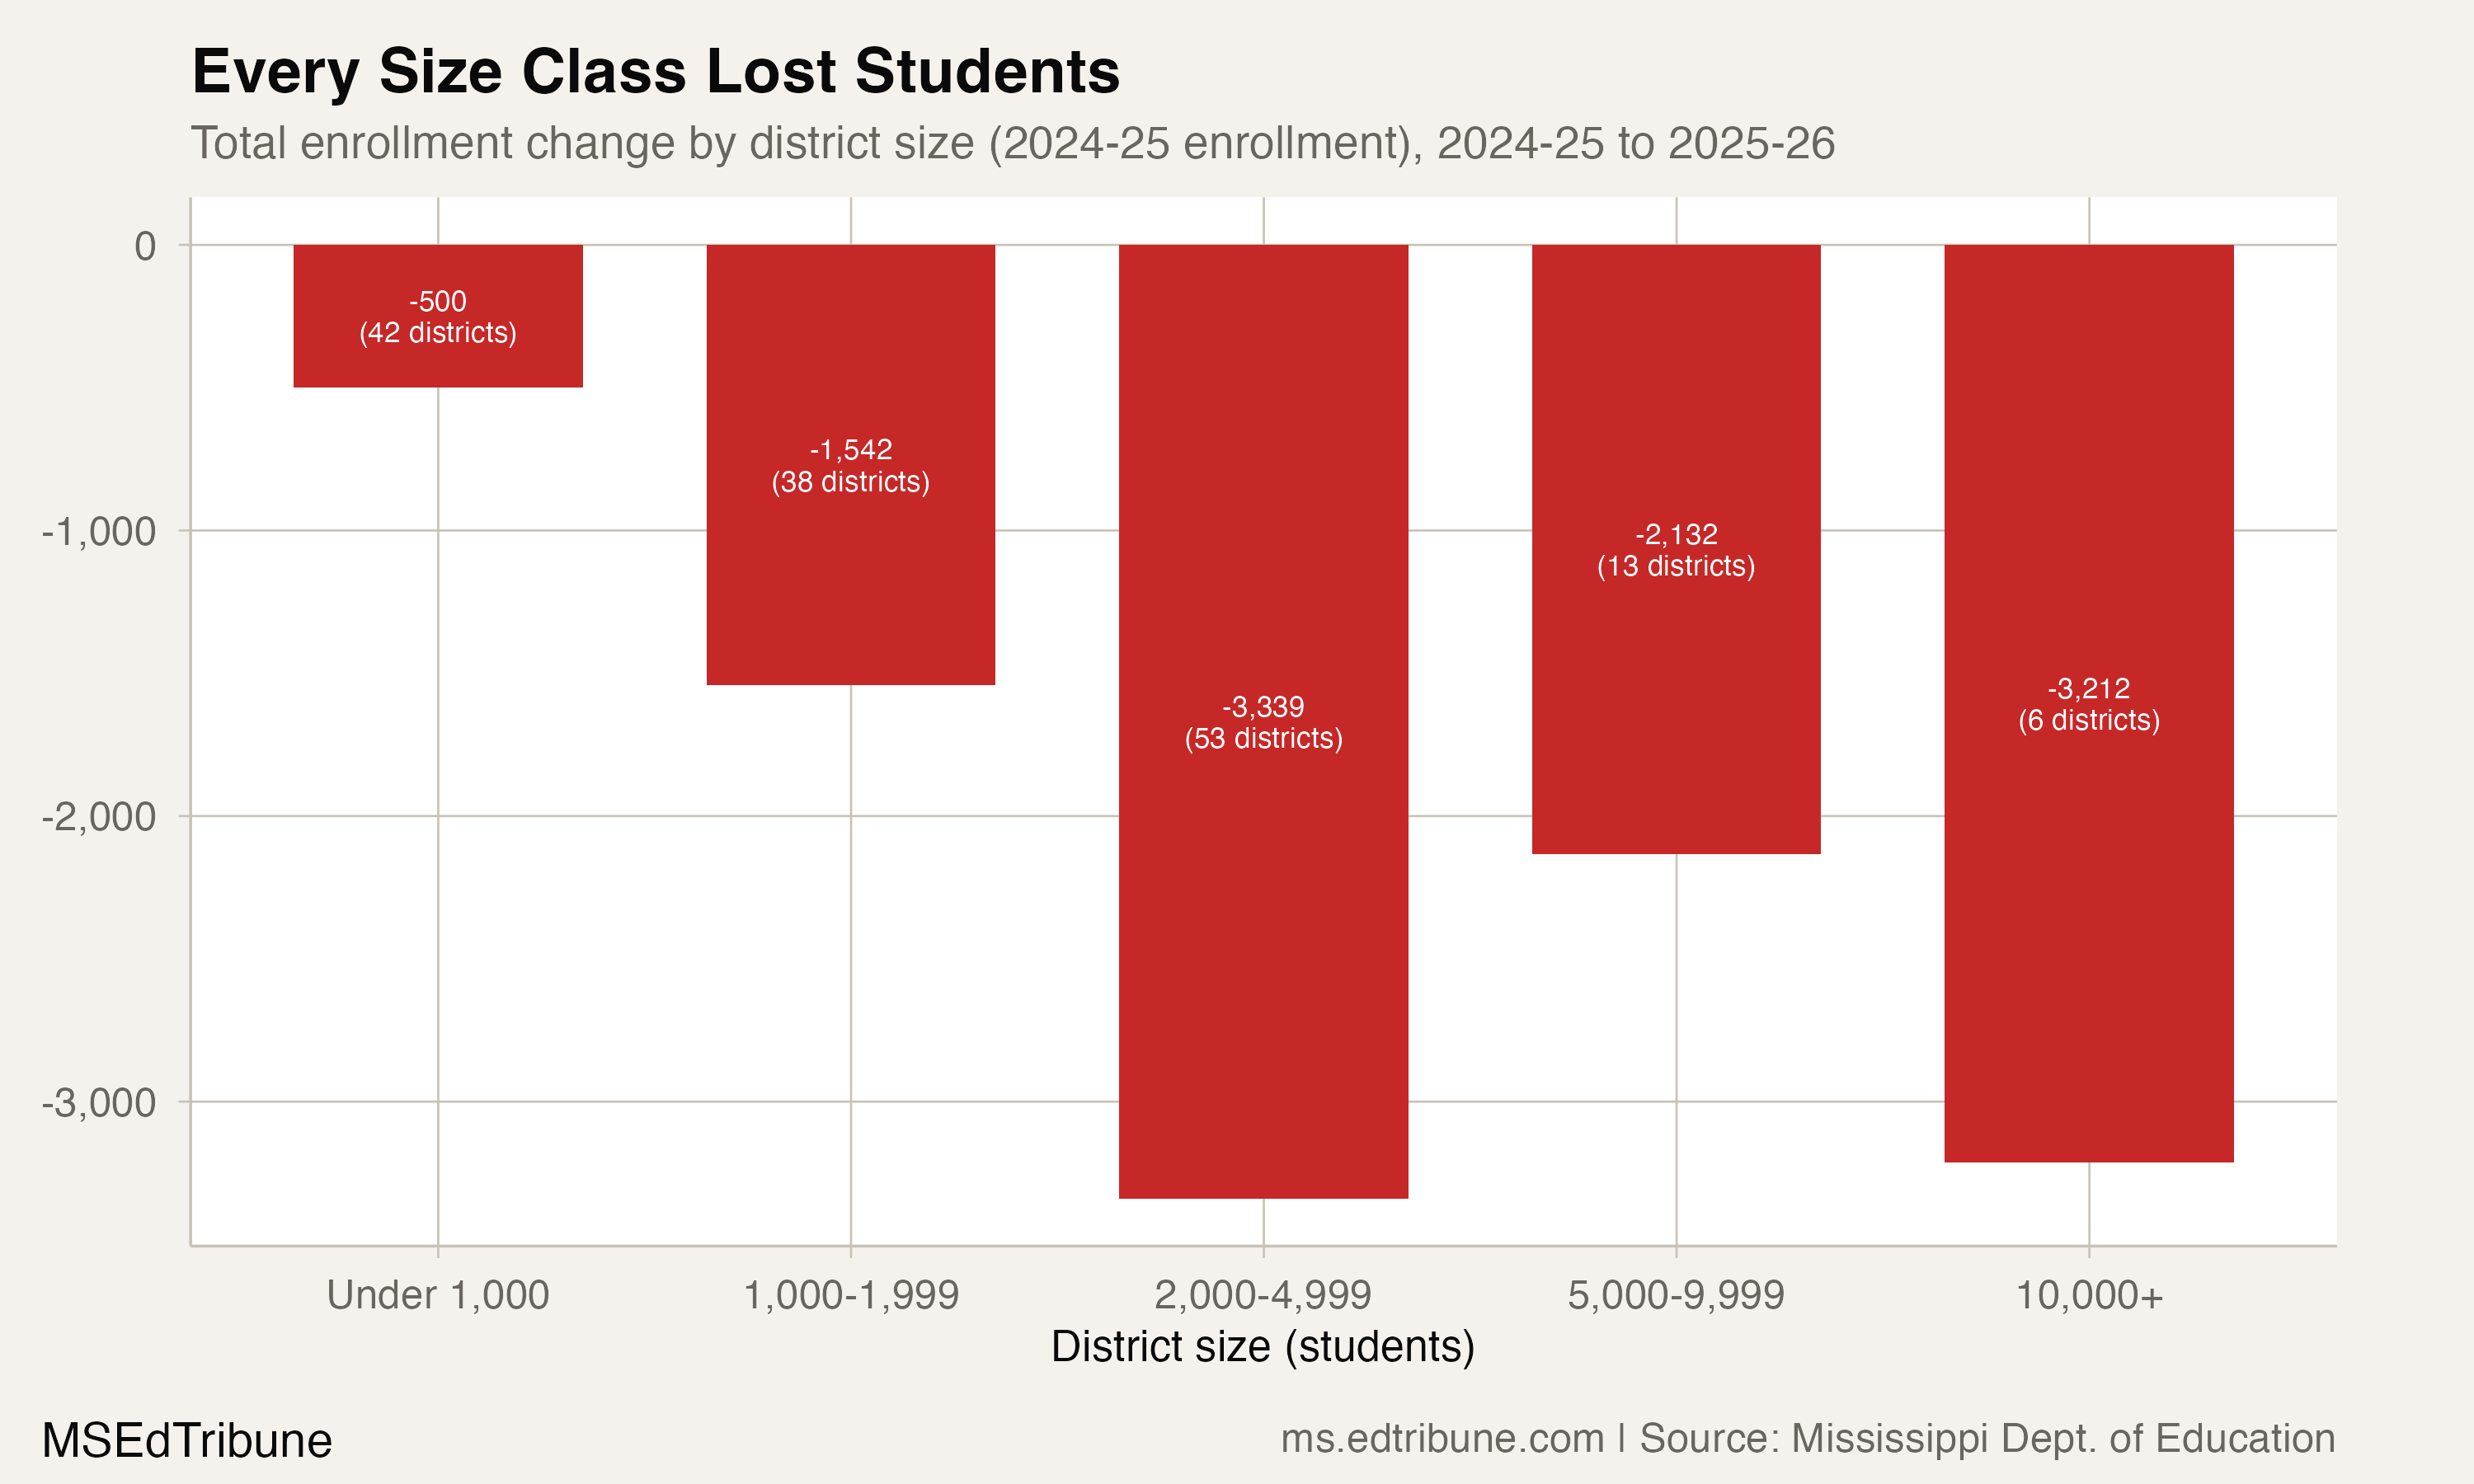
Losses across the size classes show that the statewide result was broader than a single district. They do not identify a common cause. The enrollment records do not show which students moved, transferred to private schools, began homeschooling, or left public education for another reason.
What the smaller kindergarten class shows
Kindergarten enrollment offers the clearest window into Mississippi's demographic pipeline. In 2015-16, 37,573 children entered kindergarten. In 2025-26, that number was 32,225, a 14.2% decline. The kindergarten class has grown in only two of the ten years since, a gain in 2022 and a one-student uptick in 2025. These are comparisons of enrolled kindergarten classes, rather than a count of births or a record of where families moved.
The 26 that grew
The districts that added students last school year included Greenville Public Schools and several smaller systems. Greenville Public Schools led with 194 new students, a 5.9% gain. Other gains included Revive (+88), Ambition Preparatory (+78), Instant Impact Global Prep (+37), and Midtown Public Charter School (+24). Petal (+52), New Albany (+39), and Forest Municipal (+64) posted modest gains.
The pattern is notable: among the 26 growing districts, the combined gain was 832 students. That is less than the loss in Rankin County alone.
Enrollment and the funding formula
The Mississippi Student Funding Formula uses net enrollment rather than average daily attendance. It also includes additional support for student needs and a local contribution. A smaller enrollment base therefore puts pressure on one part of the funding calculation, while the enrollment figures alone cannot determine a district's final allocation or which services its board should change.
Twenty-seven districts declined in every year from 2022 through 2026. The 10,725-student statewide drop in last school year's count was larger than the recent annual losses that preceded it. For district boards, the unresolved question is how to adjust staffing, programs, and facilities to the students they enroll while preserving services families need. The enrollment record measures the change in scale; it does not settle those local decisions.
Detailed code that reproduces the analysis and figures in this article is available exclusively to EdTribune subscribers.
Discussion
Sign in to join the discussion.
Loading comments...