Mississippi's 2026 graduation report does not show a widening divide. It shows a broad upward shift, with a smaller group of districts still moving in the opposite direction.
The Mississippi Department of Education report places the statewide four-year graduation rate at 90.8% for the 2024-25 school year. The published statewide cohort contains 33,649 students.
Among the 138 districts with stable state identifiers, 79 posted rates of at least 90%. The prior report had 62. At the other end of the distribution, seven districts were below 80%, down from 20 in the prior report.
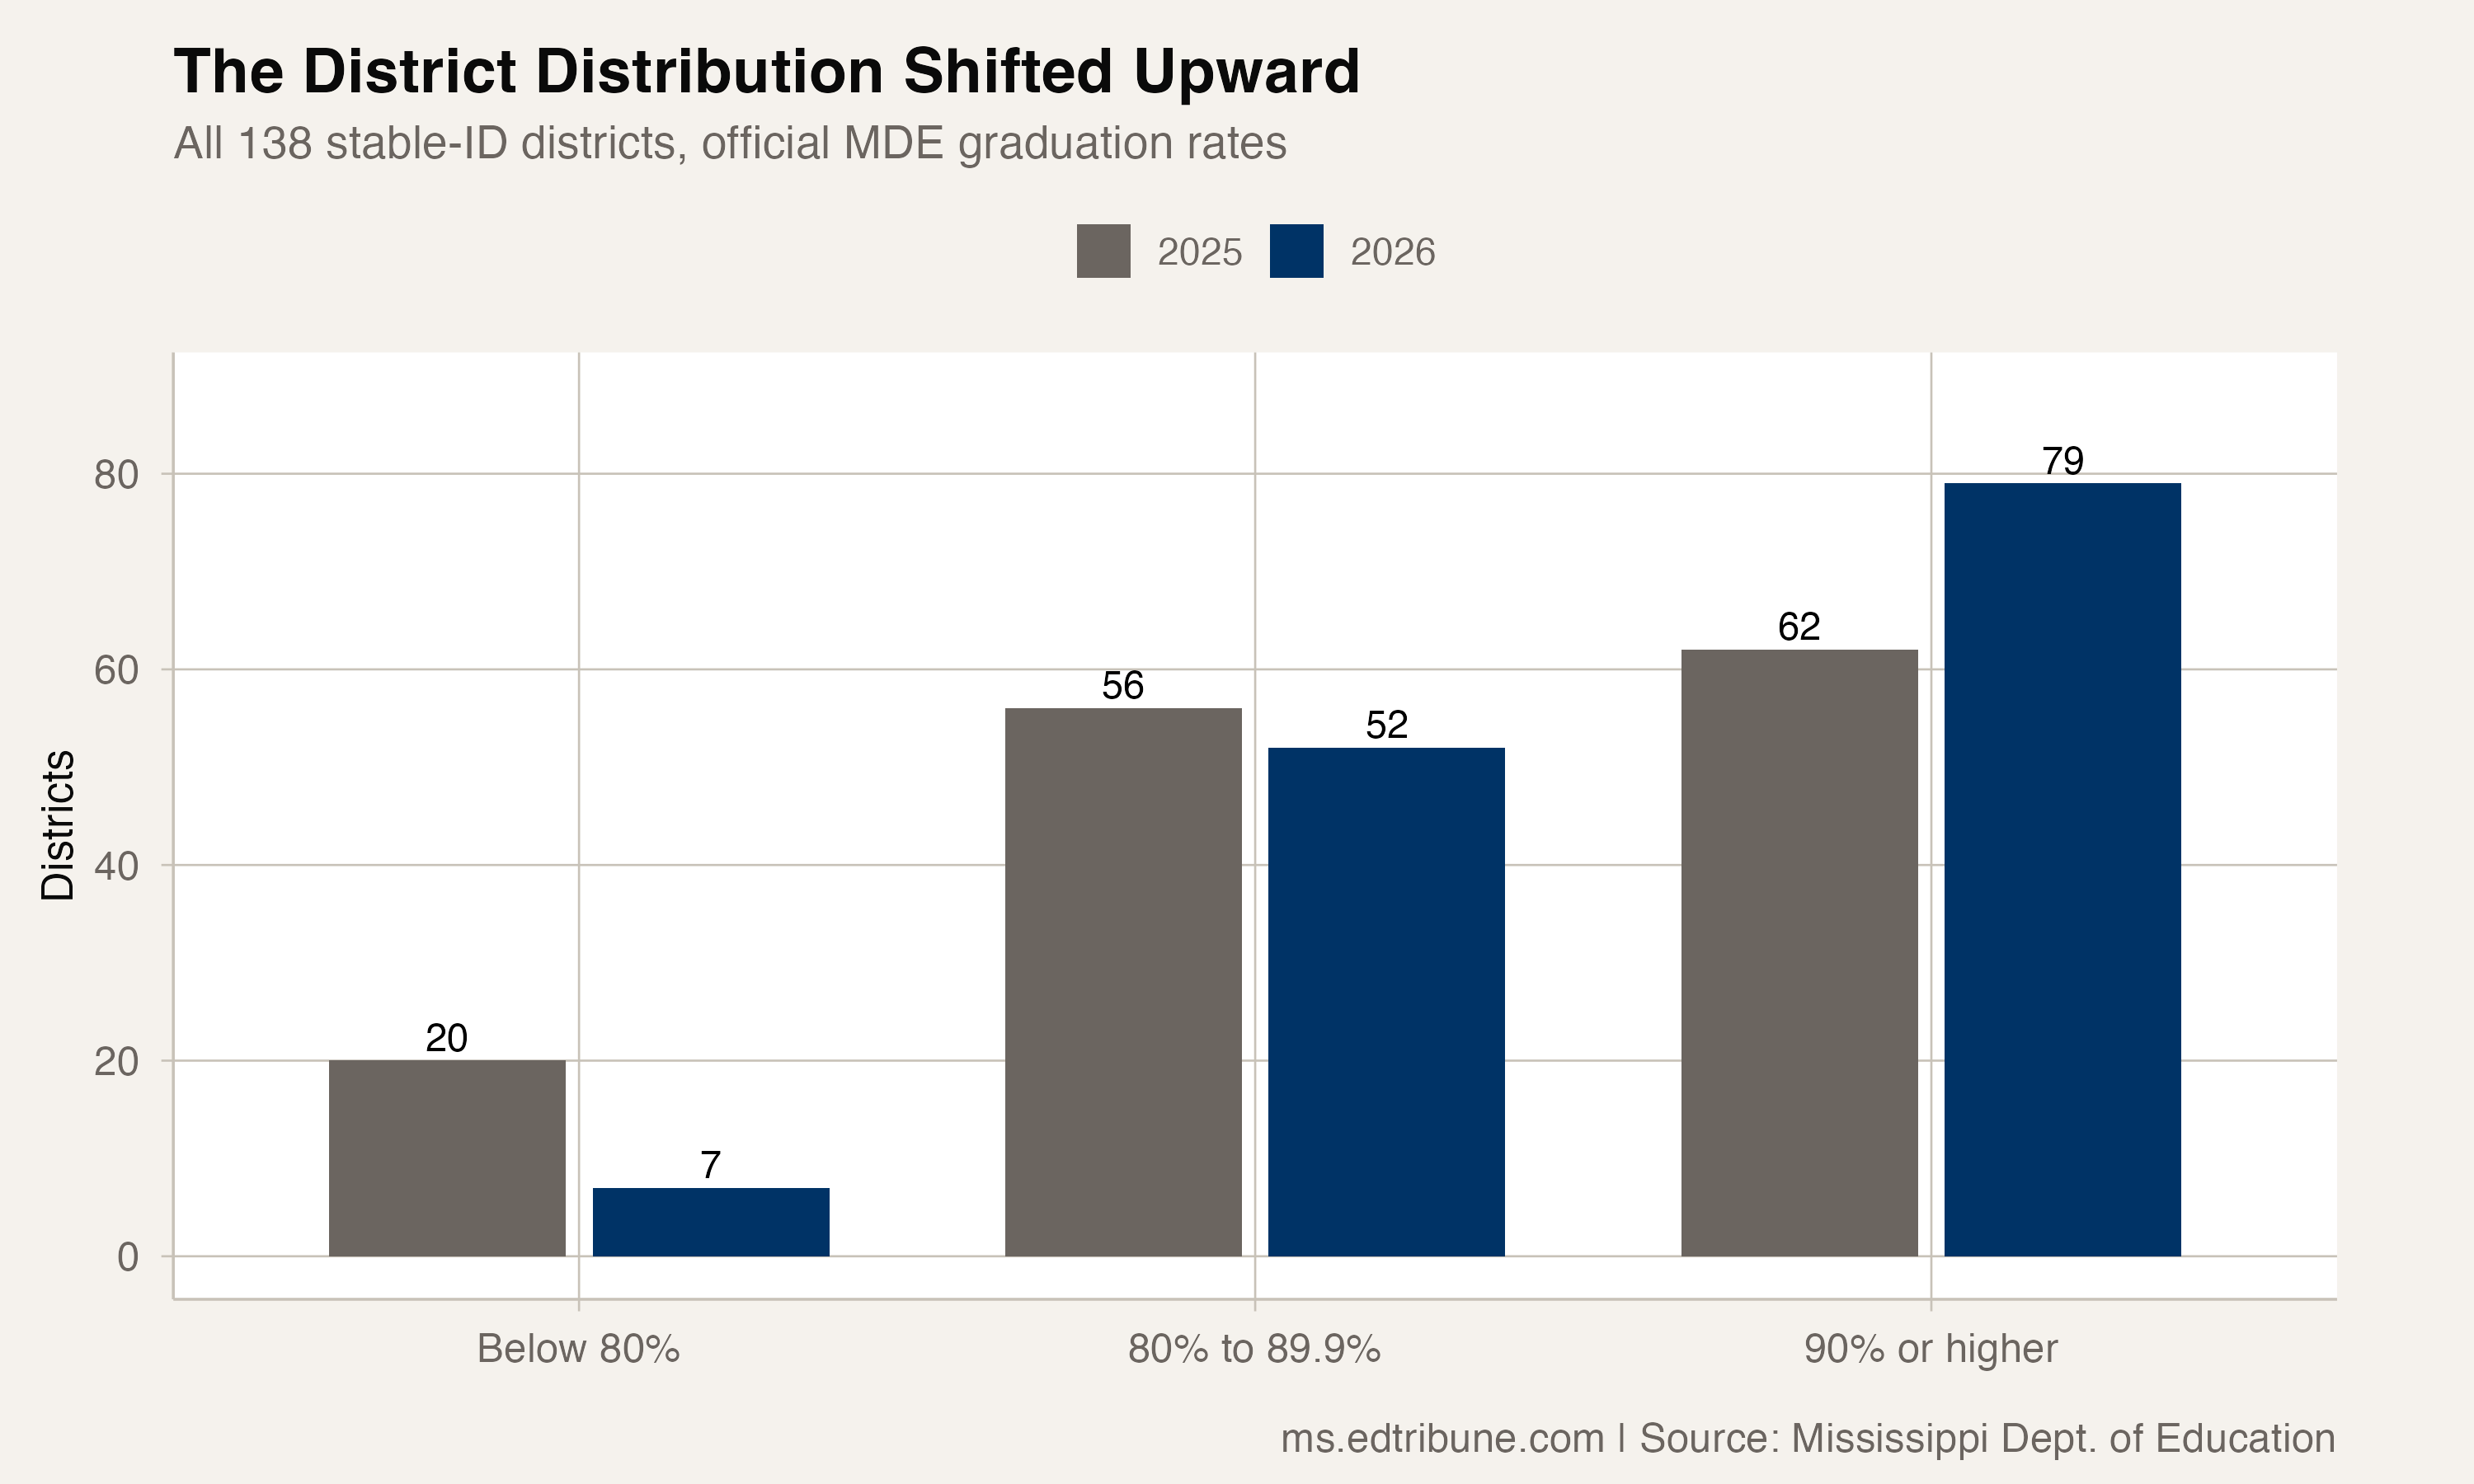
The improvement reached most districts
Matching the two reports by district ID shows 97 districts improved and 41 declined. None was unchanged. The median district gained 2.1 percentage points.
That pattern matters because a statewide rate alone cannot show whether progress was broad or concentrated. Here, the matched district comparison points in the same direction as the statewide figure.
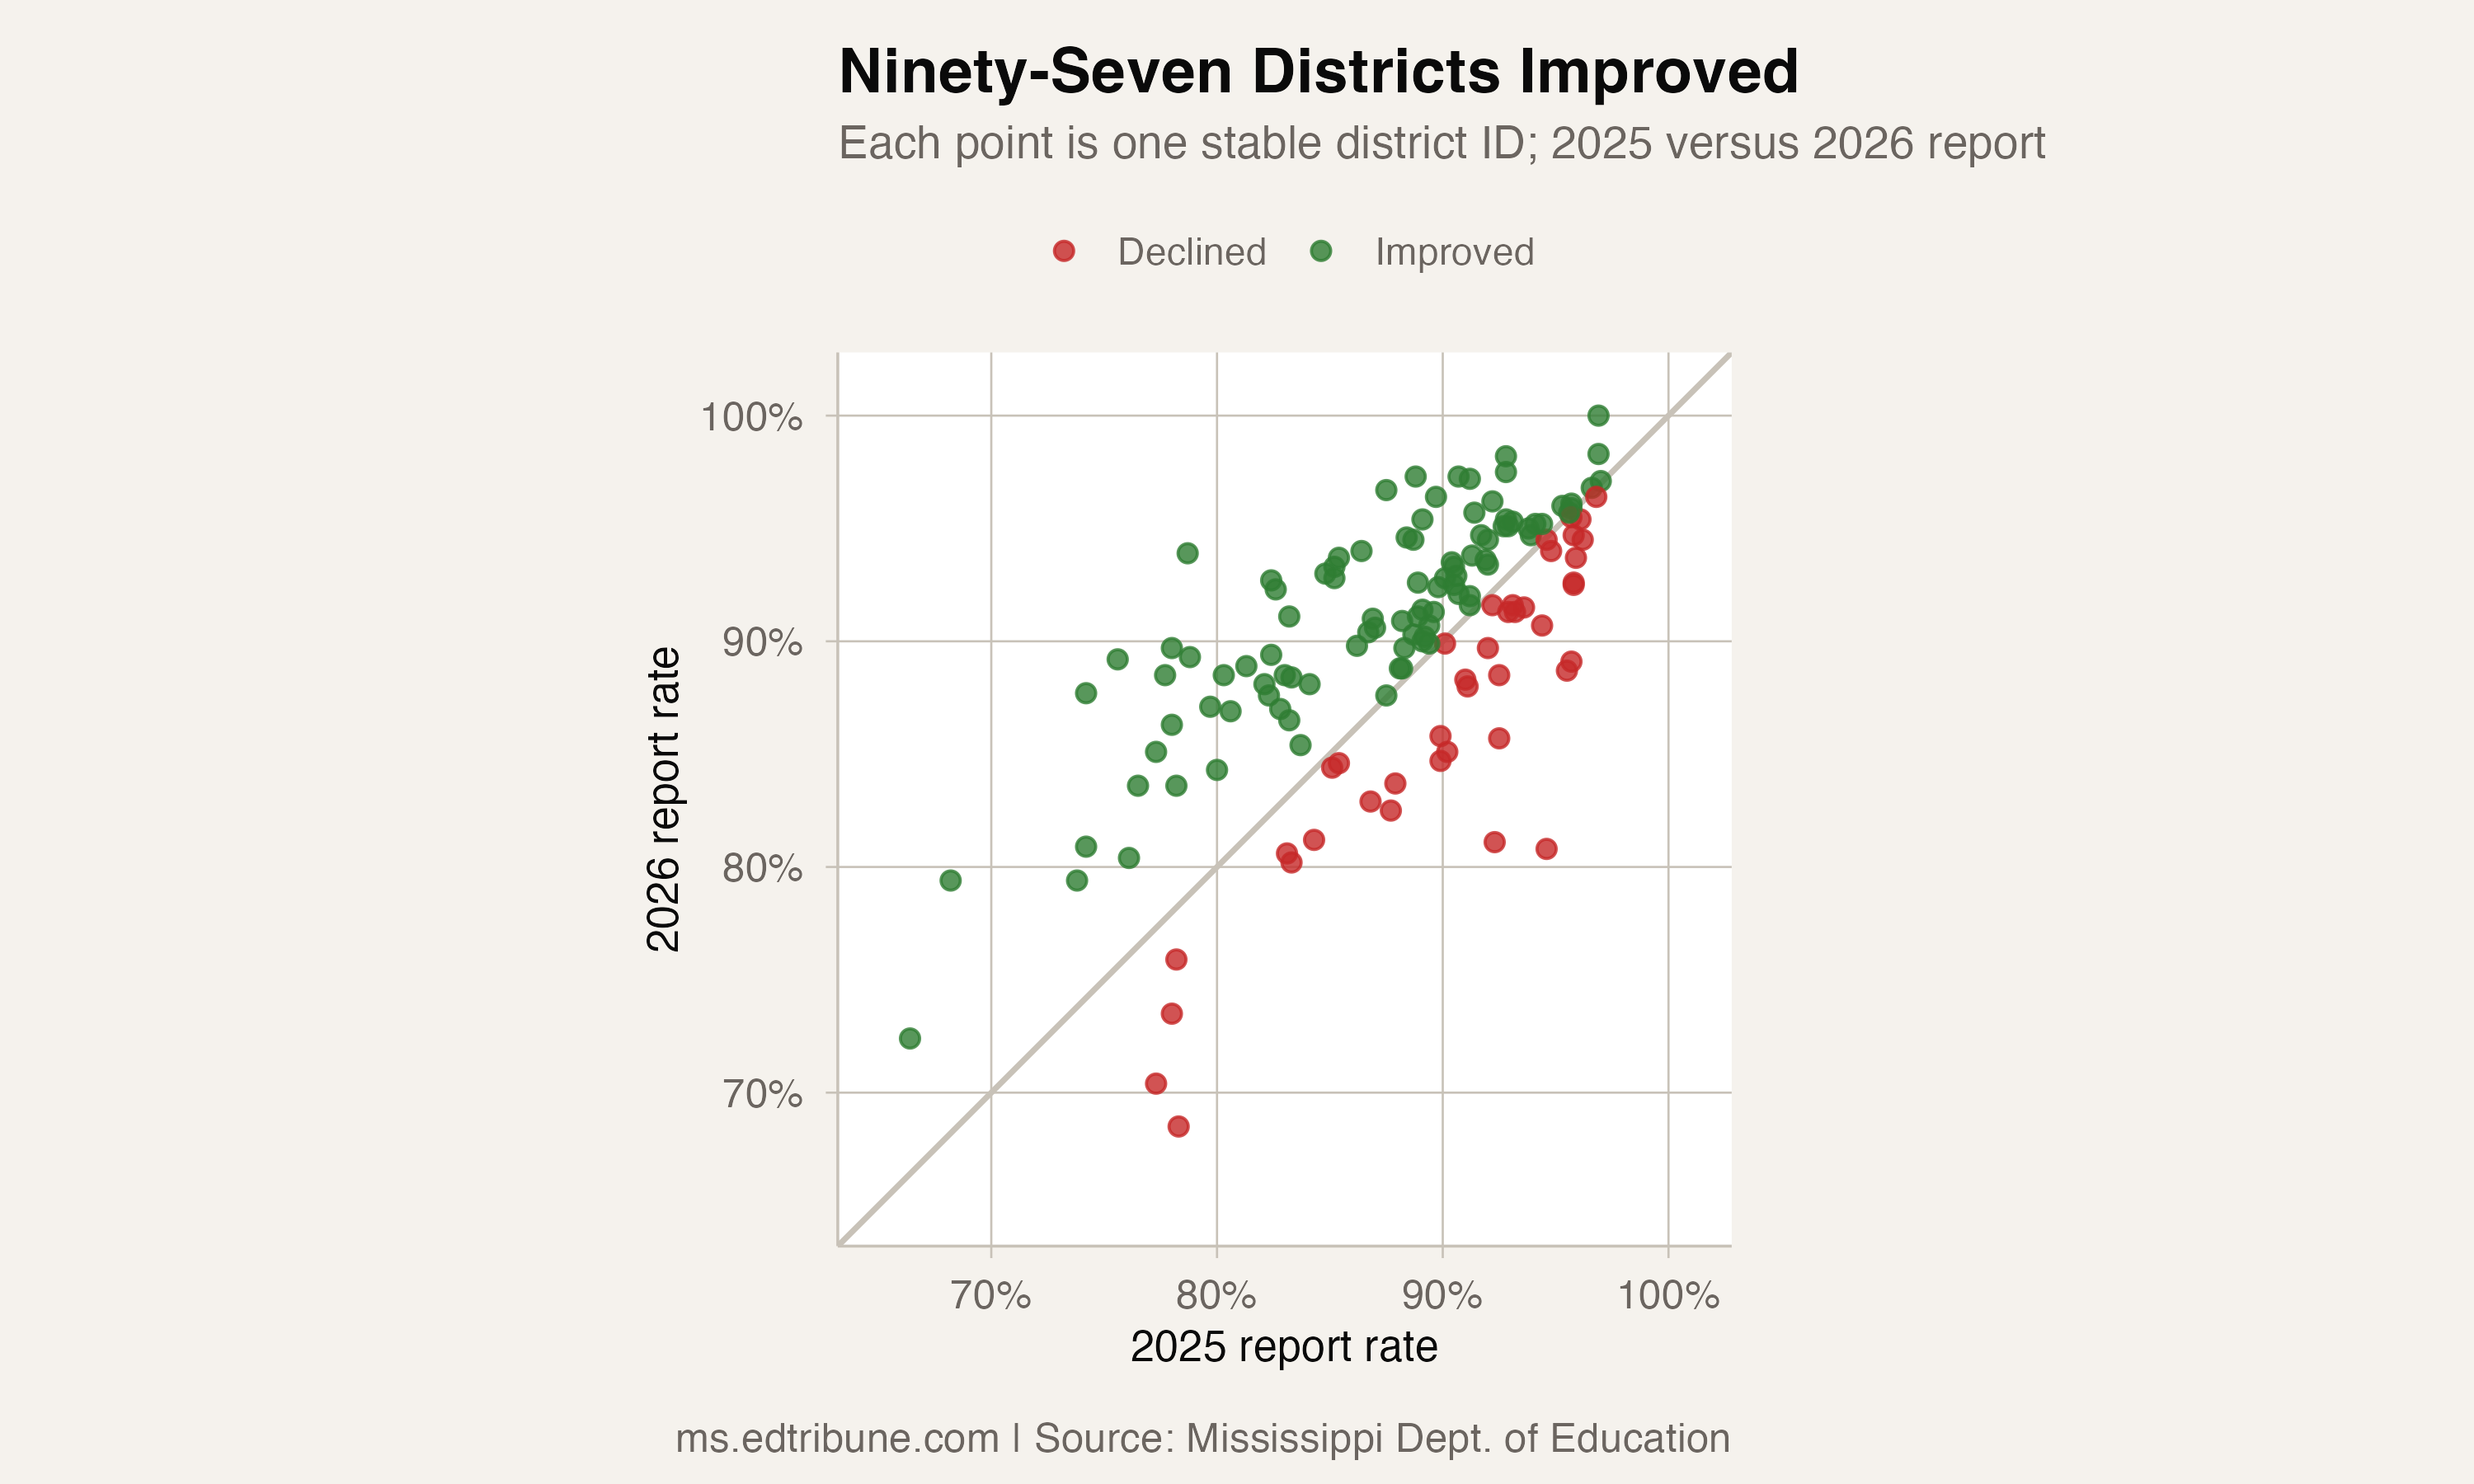
The largest increase belonged to Winona-Montgomery Consolidated School District, which moved from 78.7% to 93.9%, a gain of 15.2 points. West Point Consolidated rose from 75.6% to 89.2%, while Western Line rose from 74.2% to 87.7%.
The report also contains sharp reversals. South Delta fell from 94.6% to 80.8%, a 13.8-point decline. Water Valley fell from 92.3% to 81.1%. Forest Municipal moved from 78.3% to 68.5%.
Those declines are not evidence of a statewide split by themselves. They are district-level changes inside a distribution that moved upward overall. The graduation files report outcomes, not causes, so the data cannot establish why any particular district rose or fell.
Forty-five districts reached an 11-report high
A fixed panel provides a second check. There are 127 districts with a published rate in every MDE report from 2016 through 2026. In the latest report, 45 of those districts matched or exceeded every earlier rate in their own 11-report series. Two were at their series low.
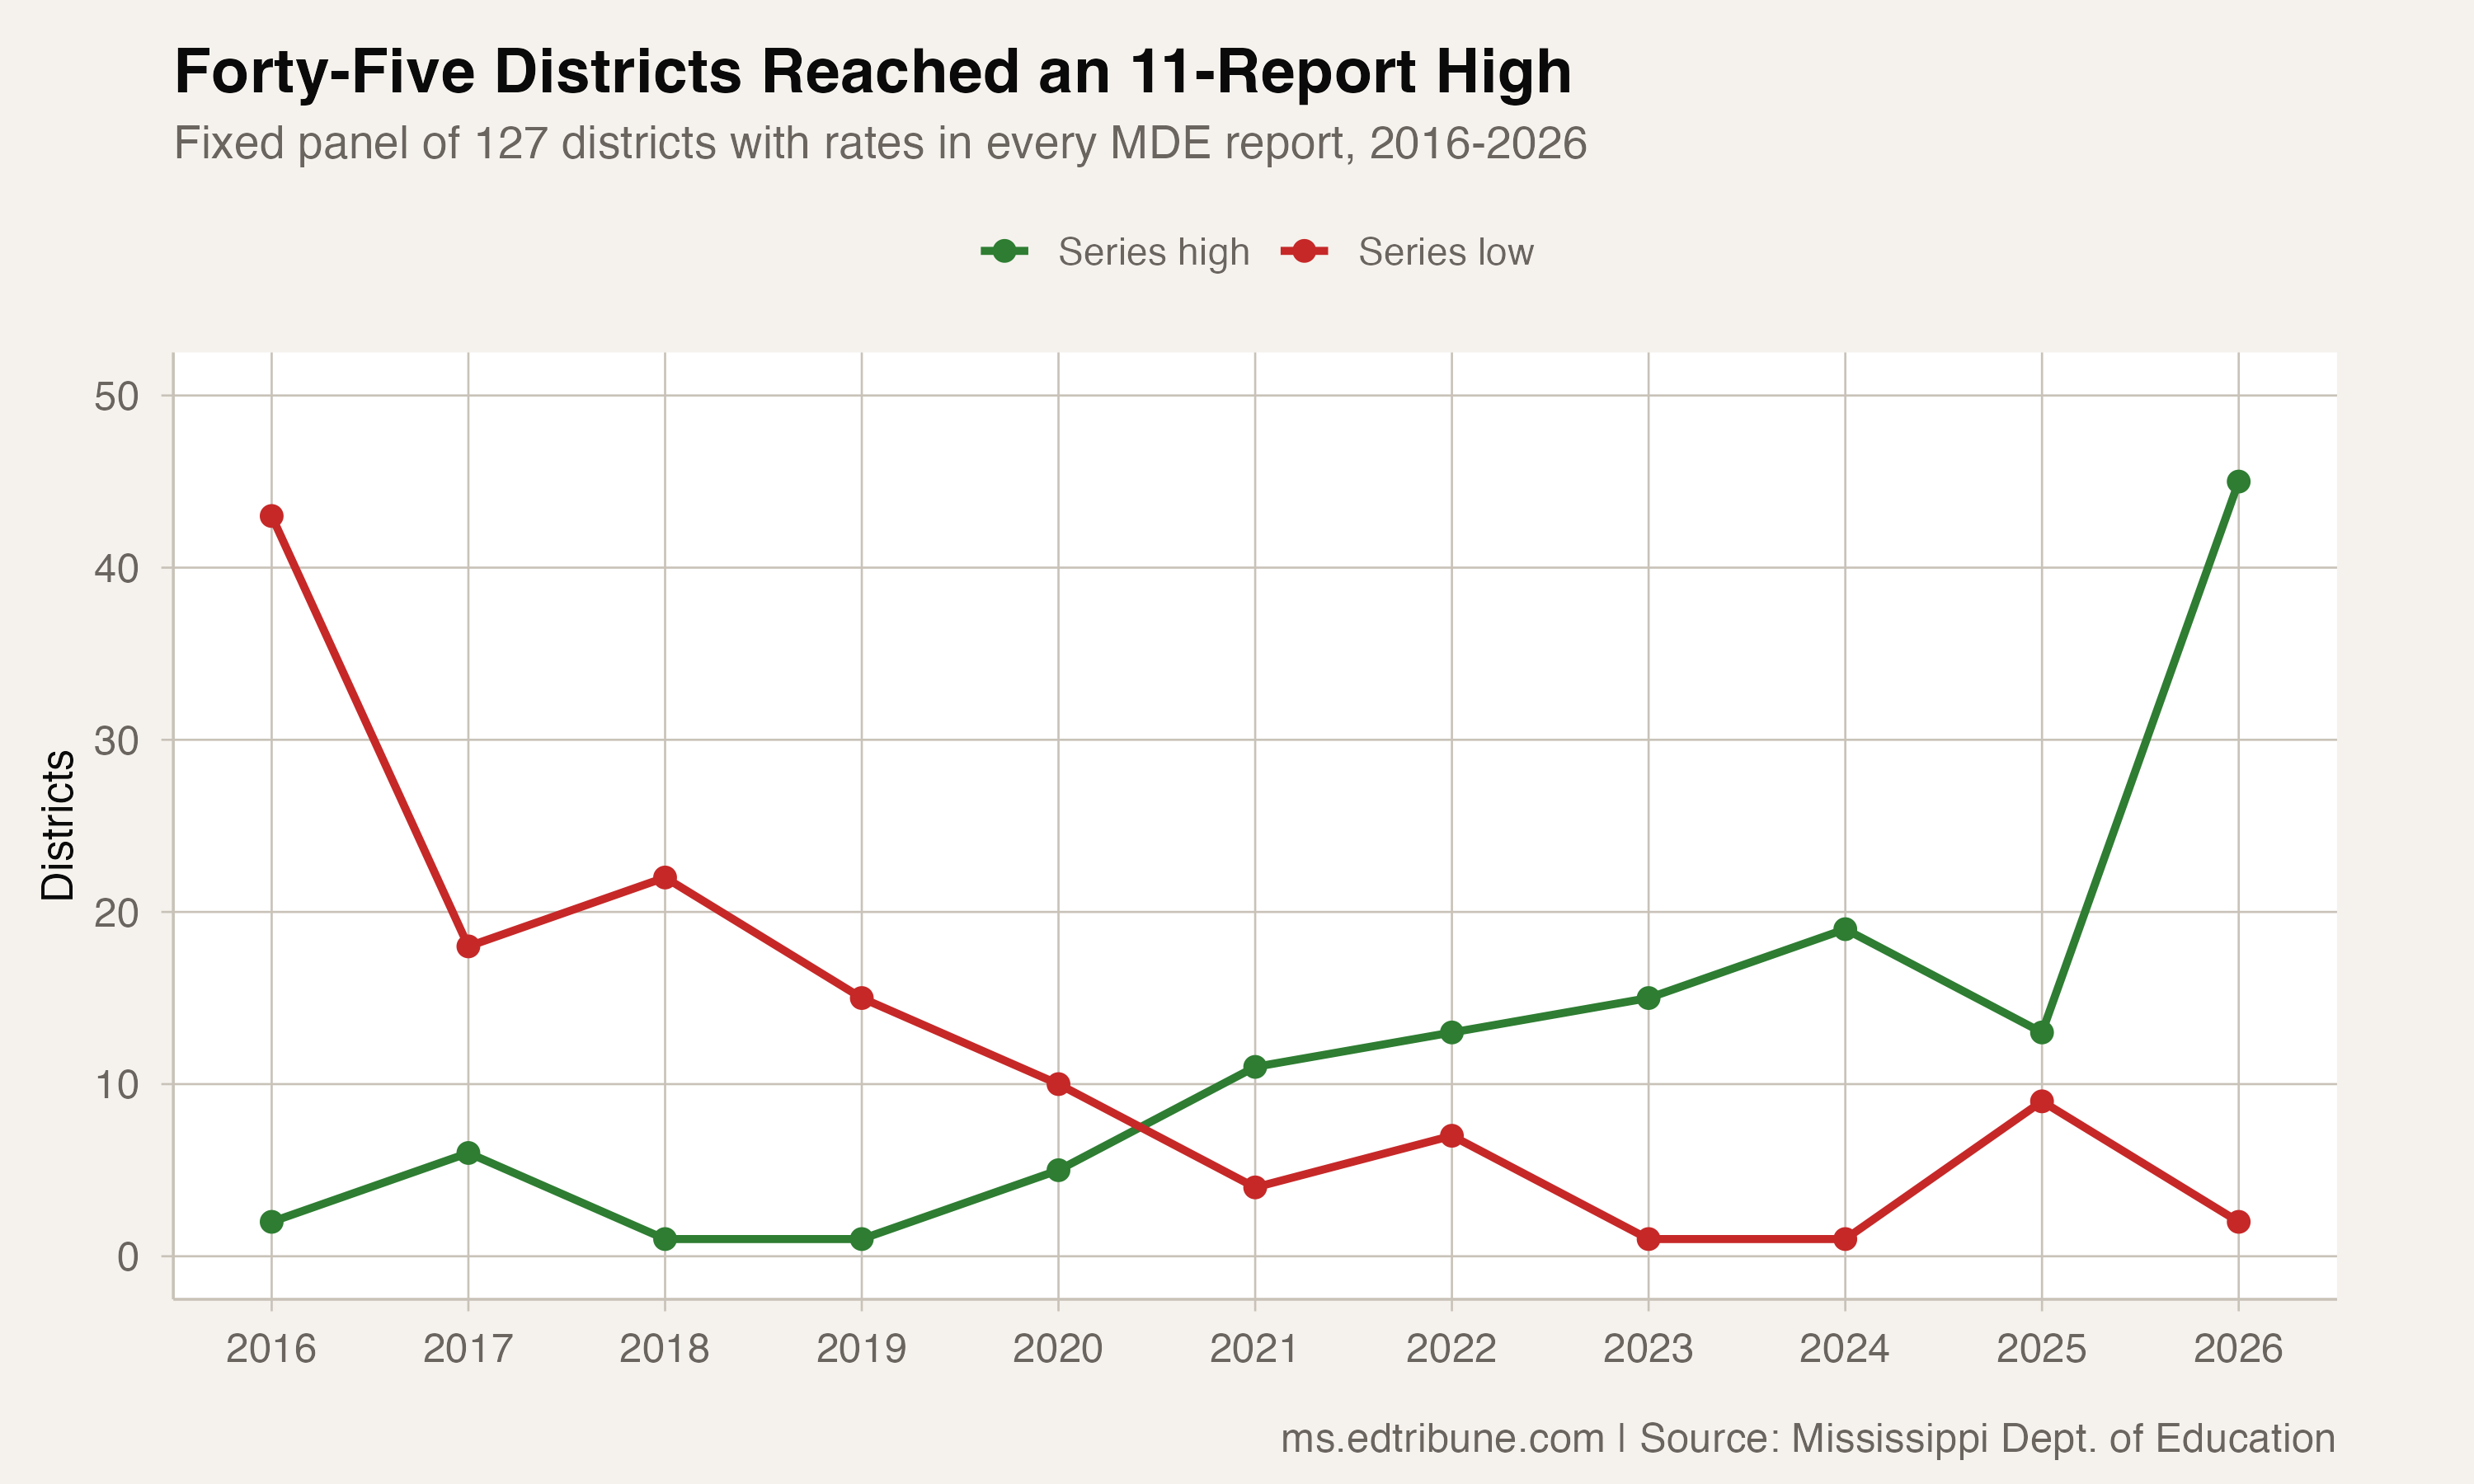
This is a stricter comparison than simply counting year-over-year gains. A district qualifies as a series high only when its latest rate is at least as high as all ten earlier observations. Using a fixed panel also prevents district openings, closures, and consolidations from silently changing the denominator from year to year.
What the report year means
The label “2026 report” is not the graduating class year. MDE's report identifies the observation as the 2024-25 school year, so the latest point describes the cohort that finished that school year. Keeping those labels separate prevents the newest release from being mistaken for a future cohort.
The analysis uses the official district identifier wherever MDE publishes one. The package reconciles the 2020 and 2026 PDF names to adjacent official MDE files and rejects ambiguous or duplicate IDs. Rows without a stable district ID are not included in district comparisons, and the statewide rate comes only from MDE's published state row—not from an average of district percentages.
The result is narrower than an explanation of Mississippi's graduation gains, but stronger as a measurement: the latest official report shows improvement across most districts, a much larger 90%-plus group, and a small set of substantial declines that warrant district-level attention.
Detailed code that reproduces the analysis and figures in this article is available exclusively to EdTribune subscribers.
Discussion
Sign in to join the discussion.
Loading comments...