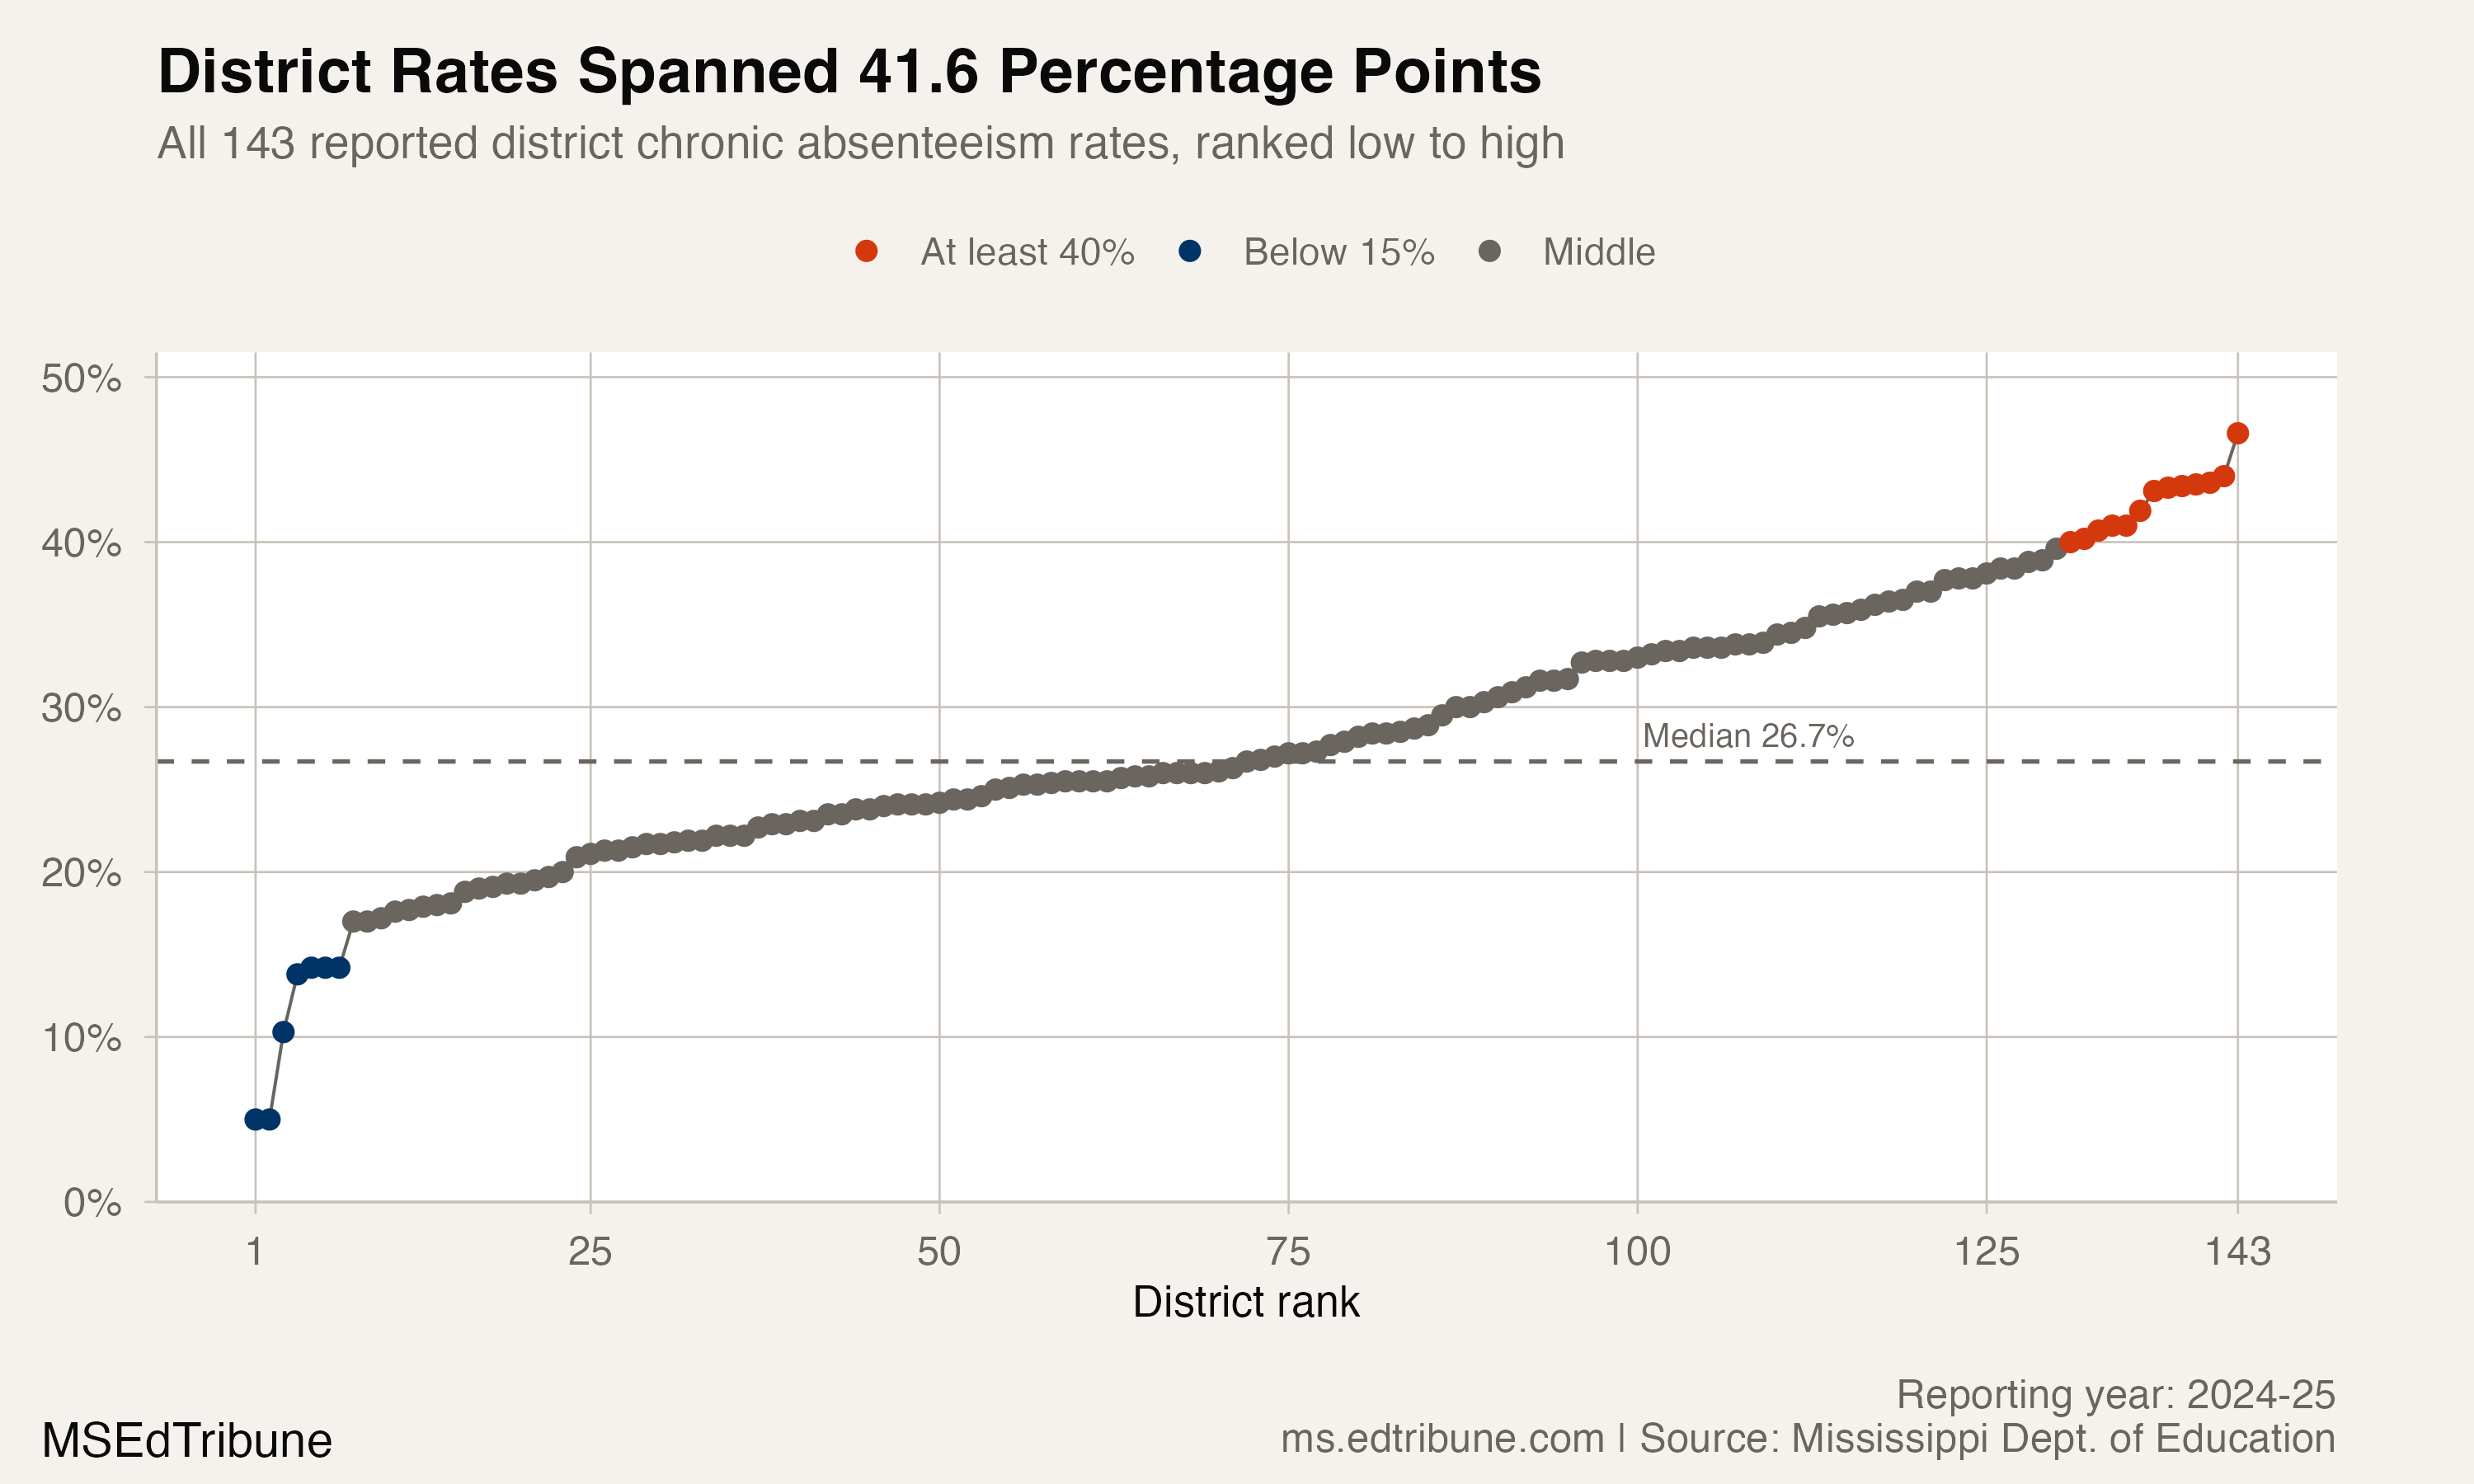
Mississippi's reported district chronic-absence rates covered a 41.6-percentage-point span in 2025.
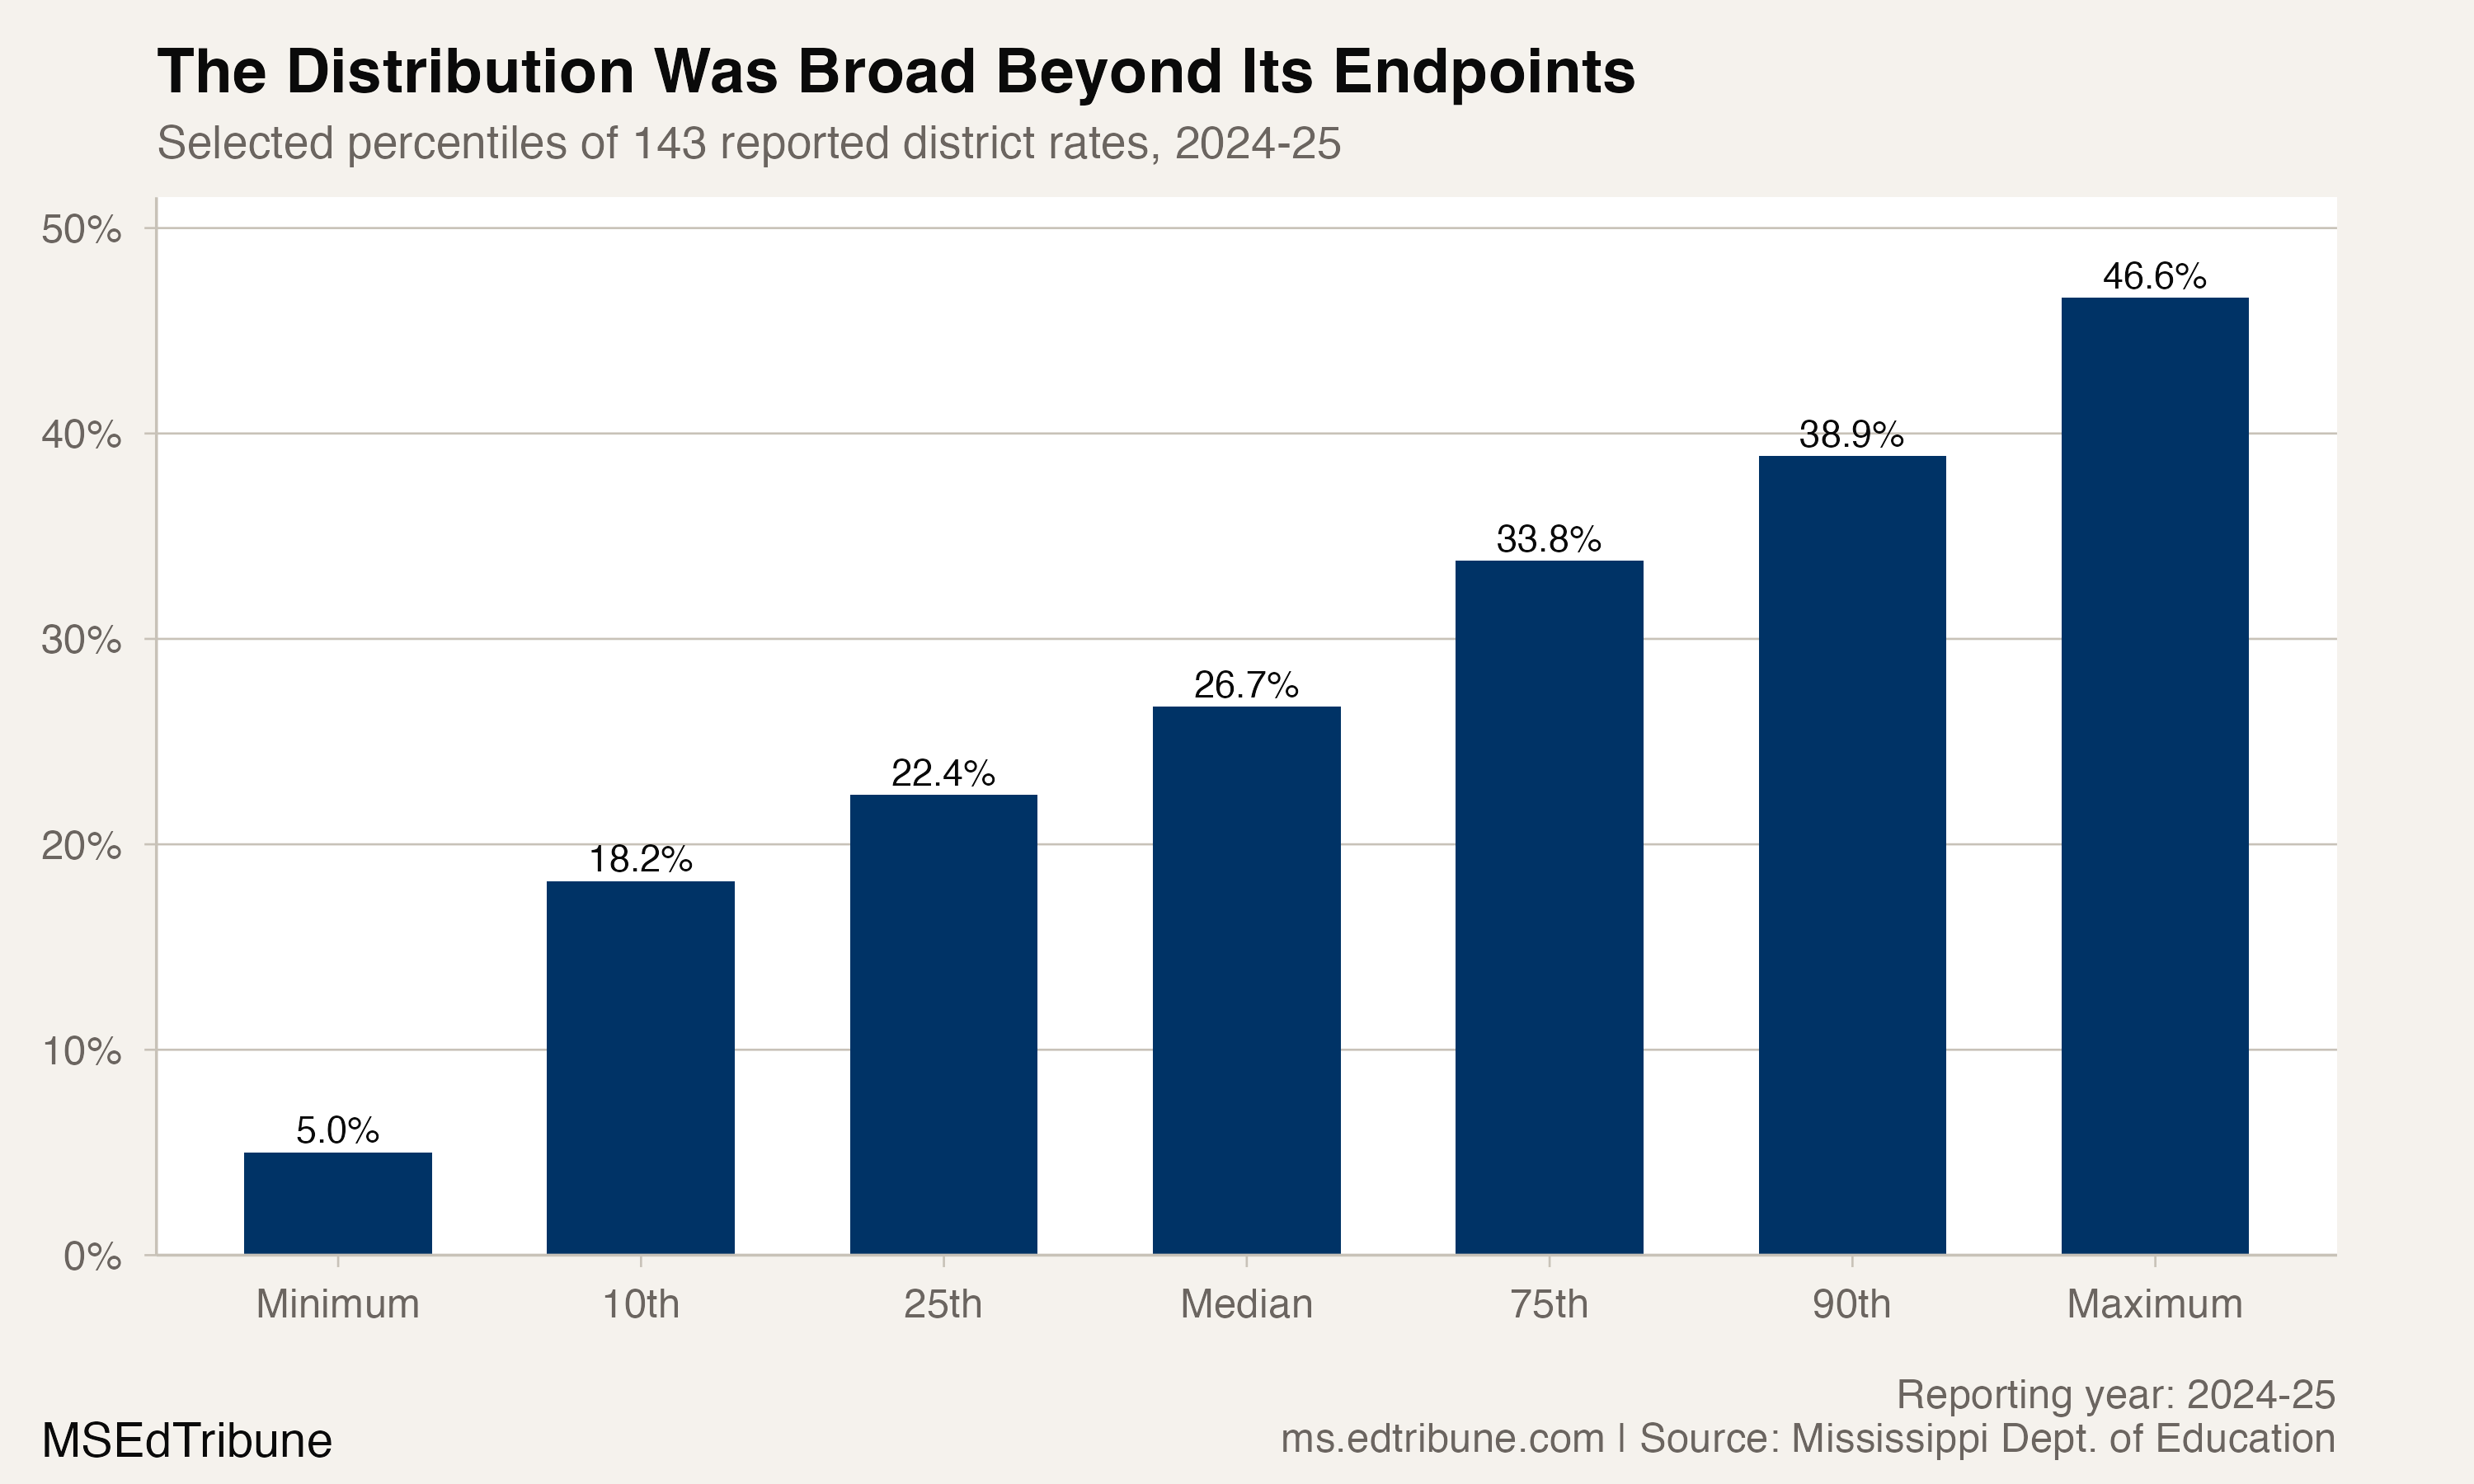
Across 143 district rows, the lowest reported rate was 5.0% and the highest was 46.6%. The median was 26.7%, placing half of the district rates on either side of that midpoint.
Those endpoints make the variation visible, but they do not mean a student was many times as likely to be chronically absent merely because of a district boundary. The file reports district aggregates, not comparable odds for otherwise similar students, and the two rows at the minimum require a specific confidentiality caveat.
Seven rows were below 15%
Seven district rows reported rates below 15%. The MDHS Division of Youth Services↗ET and Mississippi School for Mathematics and Science↗ET each appear at 5.0% in the analysis file, but both suppress enrollment and chronic-count fields.
MDE's underlying table describes each rate as 5% or less.
That leaves 5 below-15% systems with known positive enrollment denominators. Okolona School District↗ET reported 10.3%, followed by Jefferson County School District↗ET at 13.8%. East Jasper School District↗ET, New Albany Public Schools↗ET and Rankin County School District↗ET each reported 14.2%.
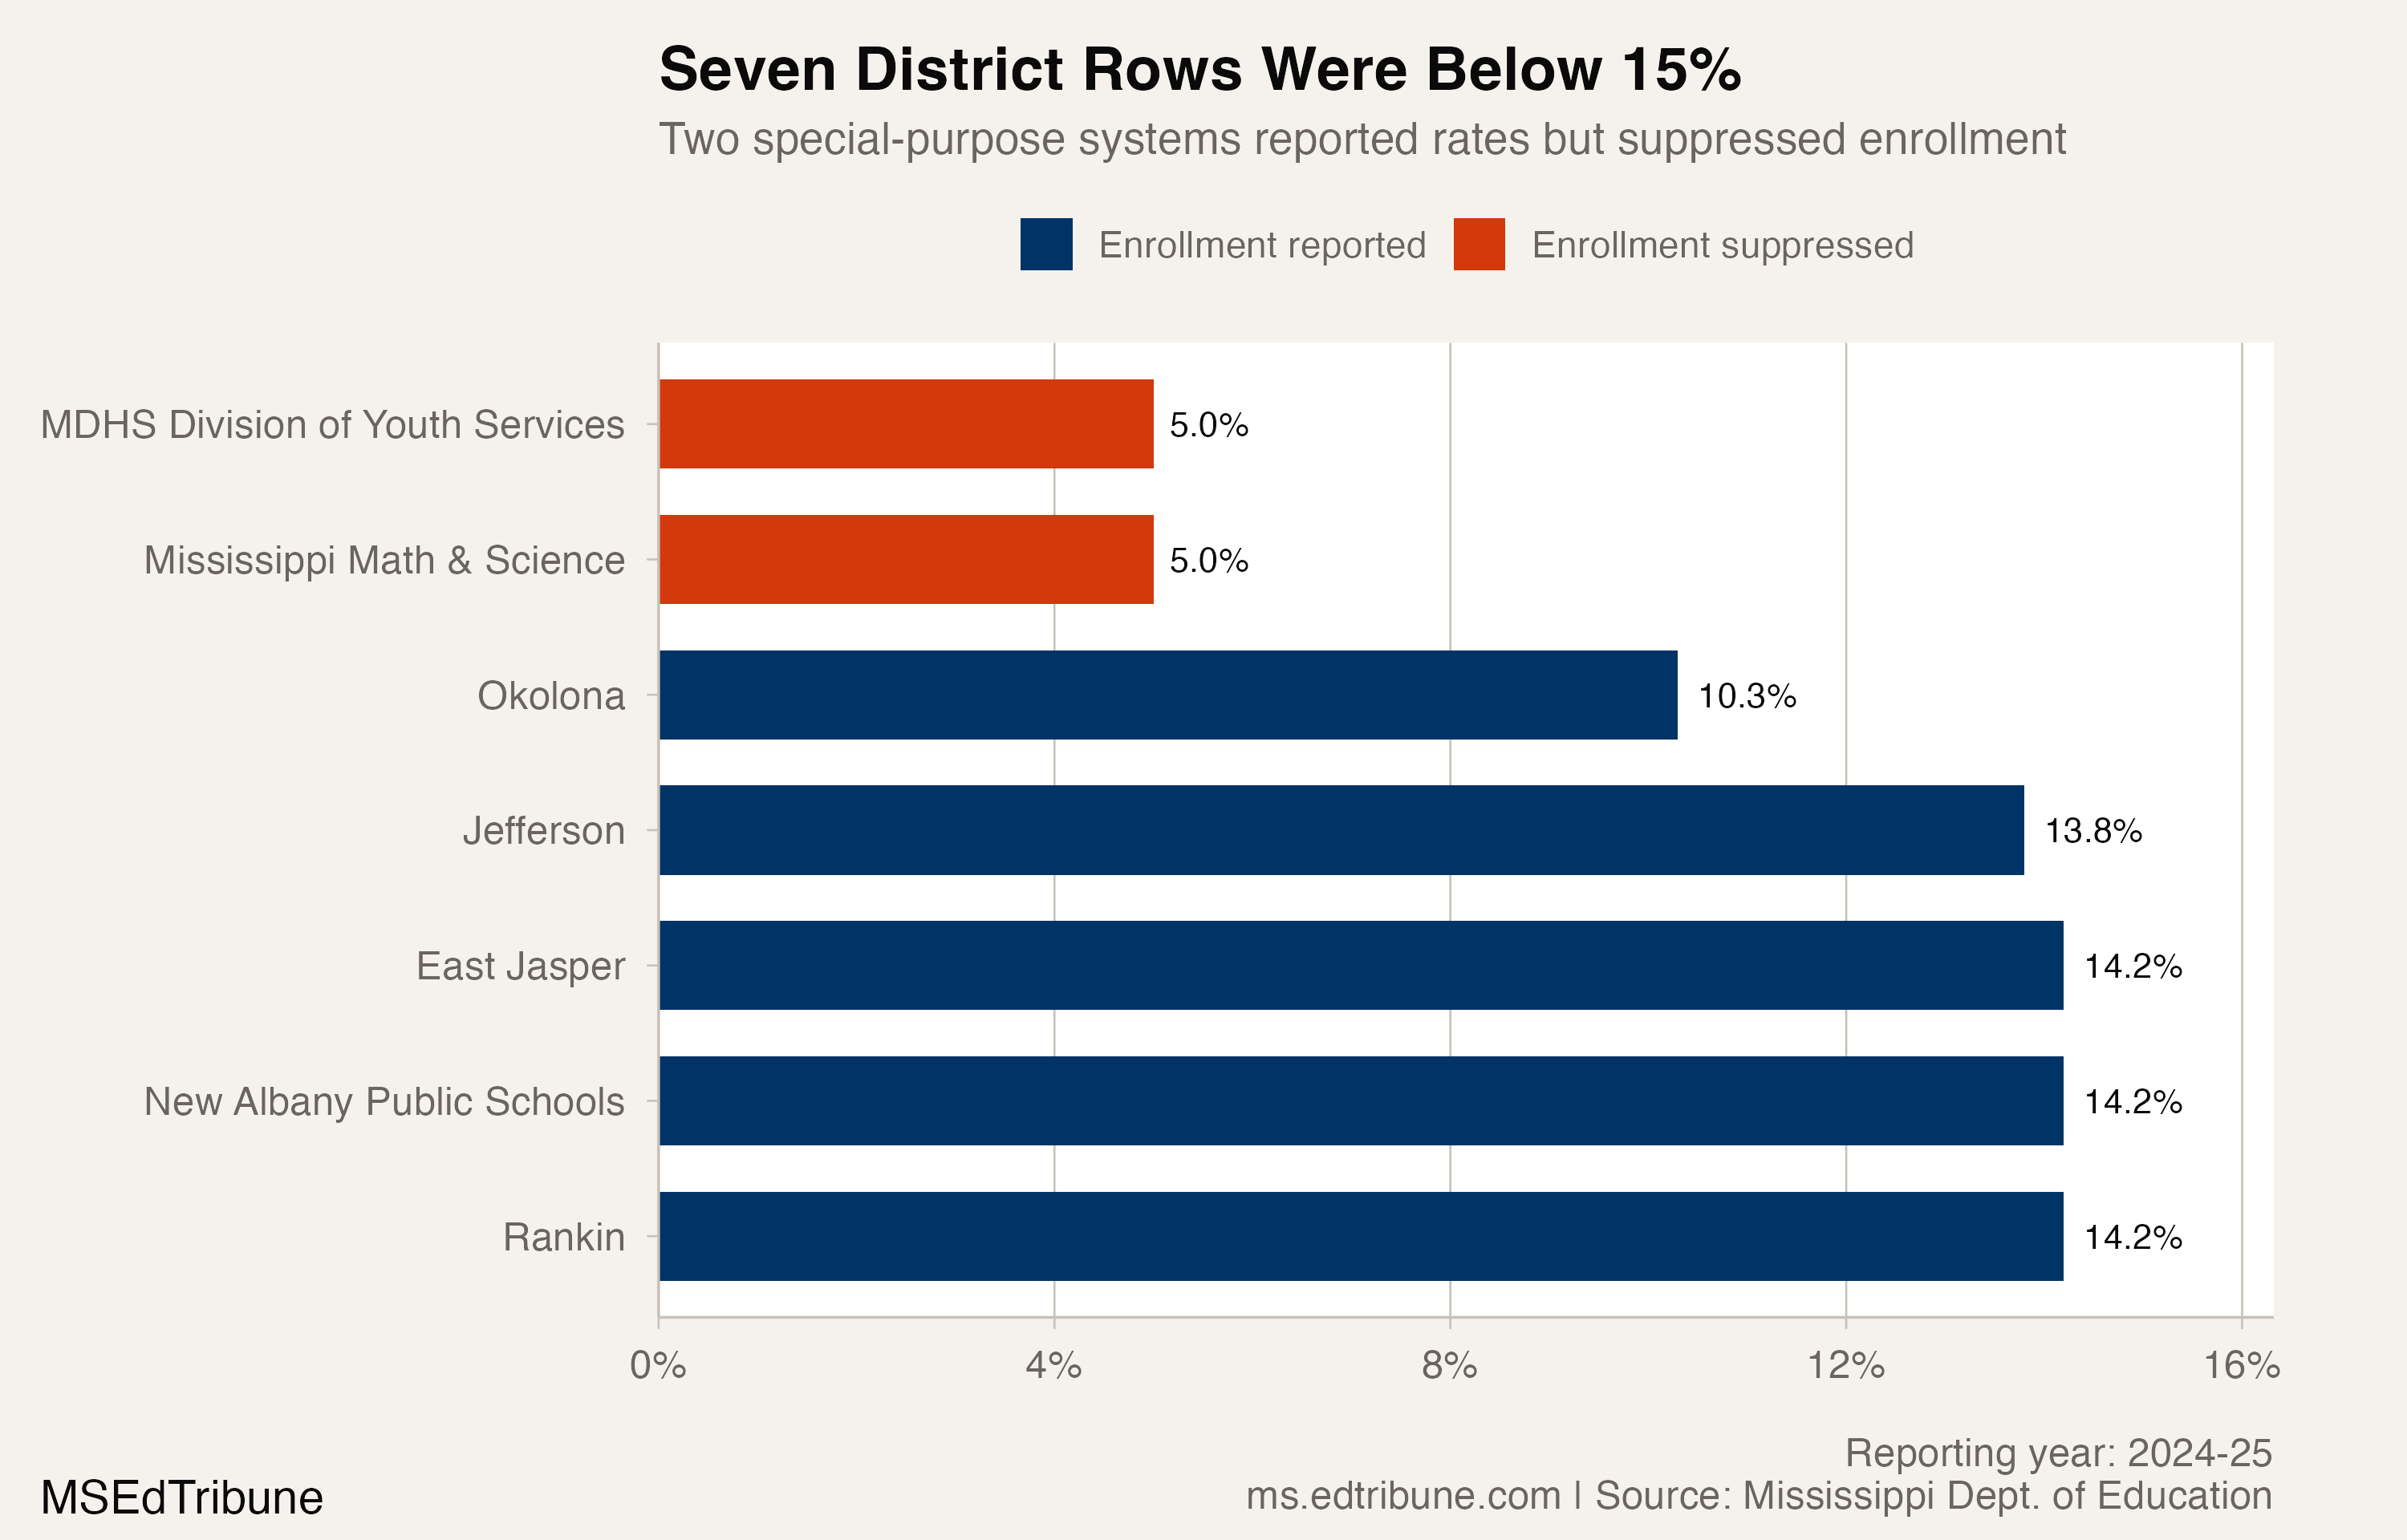
The suppressed rows belong in a distribution of published rate fields, but they cannot support student-count comparisons. That is why this analysis treats 5.0% as a reported lower boundary rather than evidence that those two special-purpose systems had the same number or share of affected students.
The middle was broad, too
The spread was not only a product of the minimum and maximum. The 10th-percentile district rate was 18.2%, while the 90th percentile was 38.9%.
The middle half of district rates extended from 22.4% at the 25th percentile to 33.8% at the 75th percentile, an 11.4-point span. Those percentile markers show that substantial variation remained even after setting aside the most extreme rows.
The upper tail was also larger than the lower one under the prespecified thresholds: 13 districts reported rates of at least 40%, compared with 7 below 15%. Claiborne County Public Schools↗ET had the maximum reported district rate, 46.6%.
What the distribution cannot explain
The district table identifies where reported rates differ; it does not identify why. District size, student composition, attendance reporting and local barriers are competing explanations that cannot be separated with these aggregate rows.
The Mississippi Department of Education's chronic-absence report recommends responses including mentoring, family engagement, alternatives to suspension, personalized outreach and attention to health barriers. Those recommendations provide a menu for local investigation, not evidence that any one mechanism produced the spread in this analysis.
This analysis uses MDE's 2024-25 district chronic-absence table, available through the department's public reporting archive. It uses all 143 rows with a published rate for rate-only comparisons and flags the 2 rows with suppressed denominators. The statewide summary does not reconcile to the district table, so this article makes no statewide numeric claim.
Detailed code that reproduces the analysis and figures in this article is available exclusively to EdTribune subscribers.
Discussion
Sign in to join the discussion.
Loading comments...